
Fraser Valley Real Estate Market Update: What the July 2026 Numbers Show
Fraser Valley Real Estate Market Update: What the July 2026 Numbers Show
The Fraser Valley is a buyer's market. In July 2026 the board recorded 1,089 sales against 10,044 active listings, a sales-to-active ratio of 11%, below the 12% to 20% band FVREB calls balanced. The composite Benchmark price is $877,600, down 7.0% from July 2025.
Two notes on the grid. The months-of-inventory figure isn't published by the board: it's calculated here as 10,044 active listings divided by 1,089 sales in the same month. And price per square foot isn't available for the Fraser Valley in this release, so active inventory takes that slot rather than an estimate. Every other number comes straight from the Fraser Valley Real Estate Board's July 2026 statistics package, released 2026-08-05.
How We Got Here
The Fraser Valley didn't arrive here through a shock. It got here through a slow accumulation of unsold homes against demand that never showed up. In July 2026 the board counted 2,836 new listings, down 14% from June and down 18% from July 2025 (FVREB, July 2026 statistics, released 2026-08-05). Sellers are putting fewer homes on the market than they were a year ago, which would normally tighten things up.
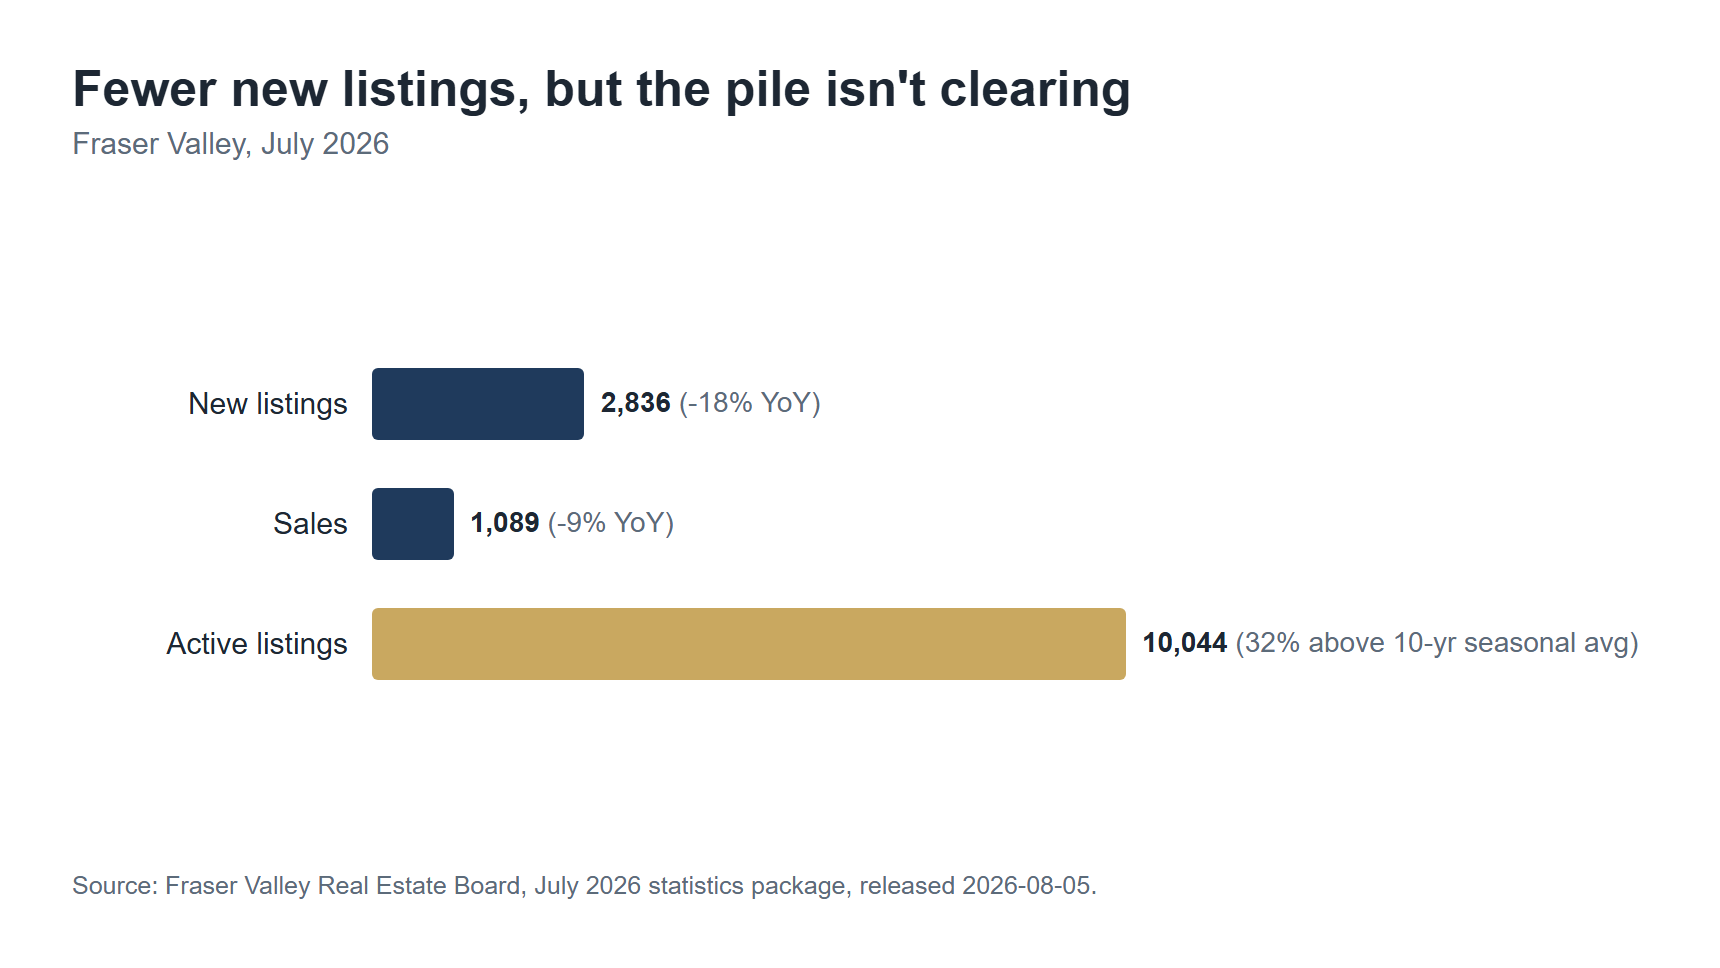
It hasn't, because the homes already listed aren't clearing. Active inventory finished July at 10,044, down only 3% from June and sitting 32% above the 10-year seasonal average for the month (FVREB, July 2026). Sales came in at 1,089, down 5% from June and down 9% from July 2025 (FVREB, July 2026). When the outflow is that slow, a smaller inflow barely moves the pile.
Ishaq Ismail, FVREB's Chair, put it plainly in the board's July 2026 release: "Buyer urgency has been notably absent from the Fraser Valley market for some time now." That's the whole story in 1 sentence. Nothing is forcing a decision, so buyers are taking their time, and time is what turns a normal listing count into a 10,044-home standing inventory.
Financing costs have stopped being the moving part. The Bank of Canada held its policy rate at 2.25% on 2026-07-15, with the next scheduled announcement on 2026-09-02. In its own words that day, "Housing activity has been weak but looks to be stabilizing." Rates aren't what's keeping this market slow, and a buyer waiting for a cut to change the picture is waiting on the wrong variable.
What the Numbers Are Telling Us
The single cleanest read on the market is the sales-to-active ratio, which was 11% in July 2026 (FVREB, July 2026). The board treats 12% to 20% as balanced. Below that band is a buyer's market, above it is a seller's market. At 11% the Fraser Valley is under the line, not by a wide margin, but on the buyer's side of it and it has been drifting that way rather than snapping back.
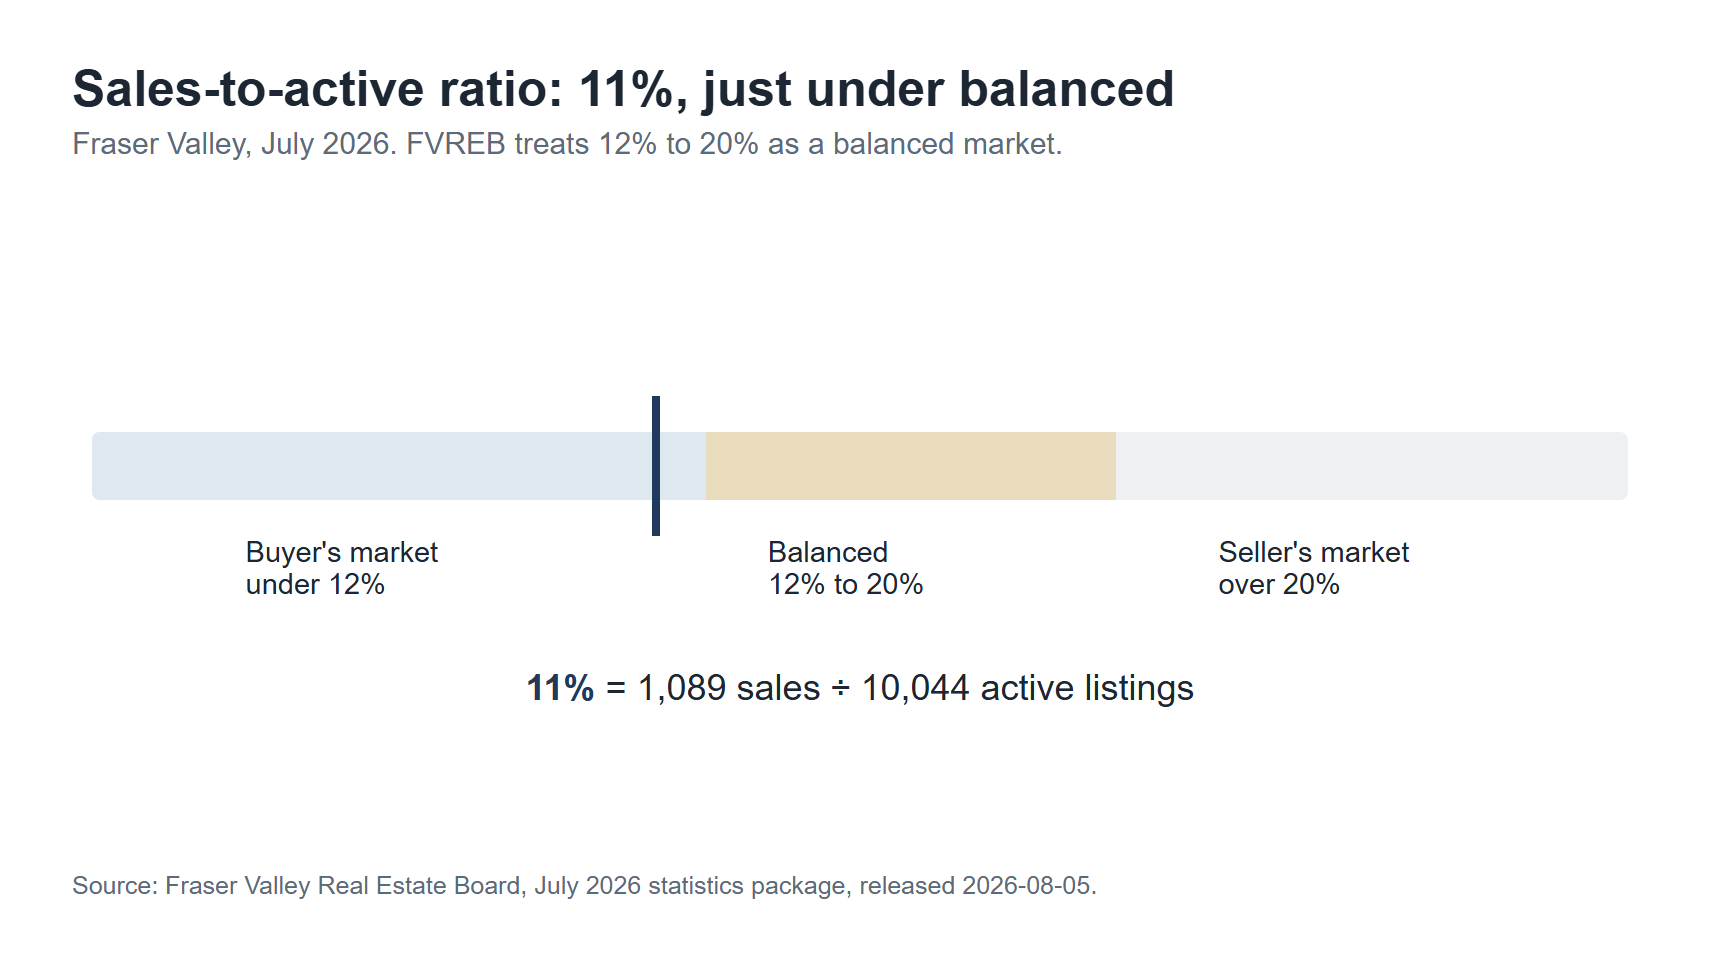
Months of inventory says the same thing in a different unit. Dividing the 10,044 active listings by the 1,089 sales gives 9.2 months, meaning that at July's pace it would take a little over 9 months to sell everything currently listed if nothing new came on. That's a calculated figure rather than a board-published one, but the inputs are both from the July 2026 release.
Prices are down across every property type, month over month and year over year. Here's where each Benchmark sits, straight from the July 2026 package:
| Property Type | Benchmark Price | Month Over Month | Year Over Year | Average Days on Market |
|---|---|---|---|---|
| Detached | $1,335,200 | Down 1.1% | Down 8.3% | 40 |
| Townhome | $757,300 | Down 0.9% | Down 7.1% | 40 |
| Apartment | $469,500 | Down 1.4% | Down 9.1% | 46 |
| Composite | $877,600 | Down 0.8% | Down 7.0% | Not reported |
Source: Fraser Valley Real Estate Board, July 2026 statistics package, released 2026-08-05.
The apartment segment is the softest of the 3, down 9.1% year over year and sitting on the longest average marketing time at 46 days (FVREB, July 2026). Detached and townhomes both averaged 40 days. Those are averages across everything that sold, so plenty of individual homes took considerably longer, and homes that were listed, withdrawn, and relisted don't carry their full history in that figure.
For province-wide context, the British Columbia Real Estate Association's 2026 second-quarter forecast, published 2026-04-27, projected BC MLS sales down 2.1% to 68,700 for 2026 before rising 7.7% to 74,000 in 2027, with the BC average price down 1.4% to $939,800. That document carries no Fraser Valley board breakout, so none of those figures describe this market specifically. They're the provincial backdrop the Fraser Valley sits inside, nothing more. If you want the local trajectory instead, the April 2026 Fraser Valley update is the closest comparison point on this site.
What This Means If You're Buying
You have leverage and, more usefully, you have time. With 9.2 months of inventory calculated off the July 2026 actives and sales, and a sales-to-active ratio at 11% against the board's 12% to 20% balanced band, there's no structural reason to make a fast decision on a home you haven't finished thinking about. The 40-day average days on market for detached and townhomes (FVREB, July 2026) means most listings aren't gone by the weekend.
That changes what a reasonable offer looks like. Subject-to-inspection and subject-to-financing clauses are far easier to hold onto in a market at 11% than one at 25%, and so is asking for a longer completion or a price that reflects where the Benchmark actually is rather than where it was a year ago. Buyers who lost out in 2021 and 2022 sometimes carry the reflex of stripping every condition to win, and that reflex costs money now for no reason.
The thing most buyers wish they'd checked first is what the same money buys across property types. Detached sits at a $1,335,200 Benchmark, townhome at $757,300, and apartment at $469,500 (FVREB, July 2026). Those gaps are large enough that the choice of type matters more to your budget than shaving 2% or 3% off any one listing, and it's worth walking through all 3 before narrowing.
What This Means If You're Selling
The good news is that new competition is thinner than it was. New listings ran 2,836 in July 2026, down 18% from July 2025 (FVREB, July 2026). The harder news is that you aren't competing with new listings, you're competing with the 10,044 homes already standing, a count sitting 32% above the 10-year seasonal average for the month.
Pricing is where this market punishes optimism. Every Benchmark fell month over month in July, so a price anchored to what a neighbour got in early 2026 is anchored above the market, and the gap widens each month you hold it. Detached was down 1.1% on the month, townhome down 0.9%, apartment down 1.4% (FVREB, July 2026). Chasing a falling market with successive small reductions is how a listing accumulates days and loses the attention it had in its first 2 weeks.
If you're selling an apartment, plan for the longest runway of the 3 types. The segment is down 9.1% year over year with an average 46 days on market (FVREB, July 2026), and that's the average, not the ceiling. It's also worth being honest about what those declines look like from the other side of the table. A composite Benchmark down 7.0% year over year, with detached down 8.3%, townhomes down 7.1% and apartments down 9.1% (FVREB, July 2026), is a market that has become measurably cheaper to buy into over 12 months. That's a discount the market has already handed your buyer, and it's in their number before you ever meet. Price to where the Benchmark sits today and you're competing on the same footing as every other seller. Price to what a neighbour got in 2025 and you're asking a buyer to give that discount back.
Thinking About Buying or Selling in the Fraser Valley?
The best first step is a quick conversation. Pick a time in the calendar that works for you and we'll talk it through.
What This Means If You're an Investor
The apartment segment is simultaneously the cheapest entry point and the weakest performer. At a $469,500 Benchmark it's less than half the detached figure, and it's also down 9.1% year over year and 1.4% on the month, with the slowest average sale at 46 days (FVREB, July 2026). Cheap and falling aren't the same thing as cheap and finished falling, and the July data doesn't tell you which of those you're looking at.
Exit liquidity deserves more weight than it usually gets in a spreadsheet. At 9.2 months of inventory, calculated from the July 2026 actives and sales, you're a price taker whenever you decide to sell, not a price setter. Anything you underwrite that depends on selling into a specific window inside the next couple of years is carrying risk the current ratio doesn't support.
On carrying costs, model today's rate rather than an anticipated one. The Bank of Canada held at 2.25% on 2026-07-15 and its next announcement is 2026-09-02. Underwriting a purchase on a cut that hasn't been announced is the same mistake as underwriting on rent increases that haven't happened, and the market is in no condition to bail out either assumption.
What to Watch Next
Four things will tell you whether August and September look like July, and none of them require a prediction to be useful. Watch the Bank of Canada's 2026-09-02 announcement, not for what it does to affordability overnight but for what its accompanying statement says about housing, given the July language was "weak but looks to be stabilizing." Watch the sales-to-active ratio in the next board release, and specifically whether it climbs back into the 12% to 20% band or holds under it.
Watch the direction of active inventory as the market moves into autumn. Listings normally thin out after summer, so the question isn't whether 10,044 falls, it's whether it falls enough to close the 32% gap to the 10-year seasonal average or just tracks the usual seasonal shape while staying well above it. And watch the Benchmark declines: 0.8% on the composite in a month is modest, but 3 or 4 consecutive months of that compounds into something a seller notices.
The August 2026 FVREB package is due in early September and will settle most of this. If you want the more uncomfortable end of a soft market, the data on Fraser Valley foreclosures is worth reading alongside these numbers, because it shows what actually happens versus what the headlines claim happens.
Frequently Asked Questions
Is the Fraser Valley a buyer's or seller's market right now?
It's a buyer's market. The sales-to-active ratio was 11% in July 2026 and FVREB treats 12% to 20% as balanced, so the Fraser Valley sits below the balanced band. There were 10,044 active listings against 1,089 sales that month.
How much is a house in the Fraser Valley right now?
In July 2026 the FVREB Benchmark was $1,335,200 for detached, $757,300 for a townhome, and $469,500 for an apartment, with a composite Benchmark of $877,600. Those are MLS Home Price Index figures for a typical home of each type, not averages of what sold.
Are Fraser Valley home prices going down?
Yes, across every property type. In July 2026 the composite Benchmark fell 0.8% from June and 7.0% from July 2025. Detached was down 8.3% year over year, townhomes down 7.1%, and apartments down 9.1%, which makes apartments the softest of the 3 segments.
How long does it take to sell a home in the Fraser Valley?
The FVREB July 2026 averages were 40 days for detached homes, 40 days for townhomes, and 46 days for apartments. Those are averages across completed sales, so individual homes ran both shorter and considerably longer, and a listing that was withdrawn and relisted doesn't carry its full history in that number.
How many months of inventory does the Fraser Valley have?
About 9.2 months, calculated by dividing the 10,044 active listings by the 1,089 sales in July 2026. FVREB doesn't publish this figure directly, but both inputs come from its July 2026 statistics package. Roughly 9 months of supply is well into buyer's-market territory.
Will interest rates coming down fix the Fraser Valley market?
Rates aren't the constraint right now. The Bank of Canada held its policy rate at 2.25% on 2026-07-15 and said housing activity "has been weak but looks to be stabilizing." The next announcement is 2026-09-02. What's missing is buyer urgency, not affordable financing.
Related Reading
- Fraser Valley Housing Market Update: April 2026
- Fraser Valley Foreclosures: What the Data Actually Shows
- Detached Homes in Surrey Are Quietly Losing Value
- Canada's Mortgage Renewal Crisis: The Math Banks Don't Show You
- Surrey Neighbourhoods Ranked: A Local's Guide to Every Major Community
- What Happens to Real Estate When the Dollar Collapses

Alex Dunbar Personal Real Estate Corporation
REAL Broker BC Ltd. | Living in the Lower Mainland
Buying, selling or investing in the Lower Mainland? Whether you're new to the area or a longtime local, I'll help you make the right move. Book a 30-minute no-pressure call with me and we'll figure out what works best for you.
Categories
Recent Posts


GET MORE INFORMATION