
Which Homes Didn't Sell? Surrey, Langley & Maple Ridge by Build Era
Which Homes Didn't Sell? Surrey, Langley & Maple Ridge by Build Era
If you're comparing detached homes in Surrey, Langley and Maple Ridge, the age of the house had a real link to whether it sold in August and September 2026. In Surrey, the newest homes came off the market without selling more often than any other era, at 62%. In Langley, that same group of new homes came in at 37%. And one decade, the 1990s, was the lowest or within 2 points of the lowest in all 3 cities.
The Short Answer
Below you'll find what the number measures, the full table for every era in every city, and what it means for you whether you're buying or selling. Every figure comes with its count, so you can see which ones rest on a solid sample and which ones don't.
- Surrey: Homes built in 2020 or later came off the market without selling 62% of the time, the highest of any era in the city. The 1990s were the lowest at 38%.
- Langley (City & Township): The oldest homes, built before 1980, were highest at 47%. The 1980s (33%) and 1990s (35%) were the lowest, and they're too close to call one of them the winner.
- Maple Ridge: Homes from the 1980s were highest at 59%. The 1990s were lowest at 32%, on a smaller group of 25 listings.
What This Number Measures
The figure in this post is the share of listings that came off the market without selling (expired or withdrawn). It's worked out from every detached listing that either sold or came off the market without selling in August and September 2026. So if 100 listings ended one way or the other, and 40 of them ended without a sale, that's 40%.
It's easy to read a number like 49% and assume half the houses in a city can't sell. That's not what it says. A listing can come off the market for lots of reasons, and a big one is price. A seller who holds out for a number the market won't pay ends up in this figure, even when there's nothing wrong with the house.
Here's how the data was checked. A first pass flagged 756 detached listings as having come off the market without a sale. Each one was then looked up in Paragon, the MLS system used here, by its MLS number. Paragon confirmed 617 of them:
- Expired: 268
- Terminated: 249
- Cancel Protected: 100
Terminated and Cancel Protected together make up 349 of those 617. Those two statuses include sellers who simply chose to pull their listing, so this isn't only a count of homes nobody wanted.
A few things are left out on purpose. Listings that came off and went straight back on the market are left out completely. So are listings with no year built, which are mostly pre-sales and new builds. And 43 listings the first pass had flagged turned out to be sales, so they're counted as sold.
The Full Table: Every Build Era in All 3 Cities
Listings that came off the market without selling (expired or withdrawn), detached homes. Each cell shows the rate, then the number that came off unsold out of the total that either sold or came off unsold.
| Build era | Surrey | Langley (City & Township) | Maple Ridge |
|---|---|---|---|
| Pre-1980 | 53% (107/201) | 47% (49/104) | 45% (25/55) |
| 1980s | 47% (71/150) | 33% (25/76) | 59% (35/59) |
| 1990s | 38% (52/136) | 35% (15/43) | 32% (8/25) |
| 2000s | 47% (69/146) | 43% (15/35) | 39% (12/31) |
| 2010s | 53% (50/95) | 45% (17/38) | 42% (10/24) |
| 2020s | 62% (37/60) | 37% (14/38) | 47% (9/19)* |
| All eras | 49% (386/788) | 40% (135/334) | 46% (99/213) |
*Small sample: 19 listings.
Source: MLS data for detached listings that left the market in August and September 2026, with each status checked in Paragon by MLS number.
Surrey: The Newest Homes Sat the Most
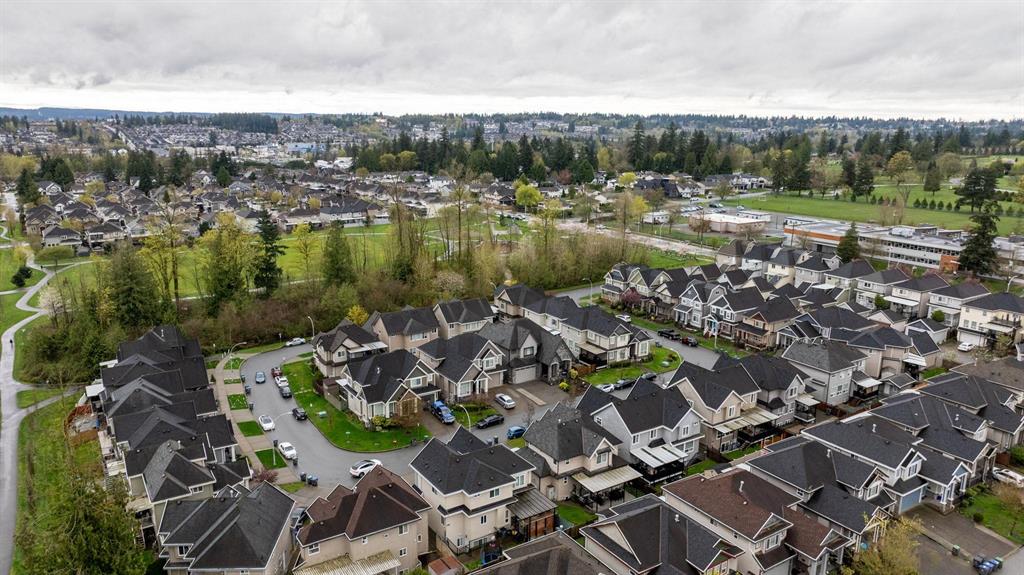
Surrey came in at 49% overall, across 788 detached listings. The surprise is at the new end. Homes built in 2020 or later came in at 62%, which is 37 of 60. You'd expect the newest house on the street to be the easiest one to sell, and in Surrey it was the opposite.
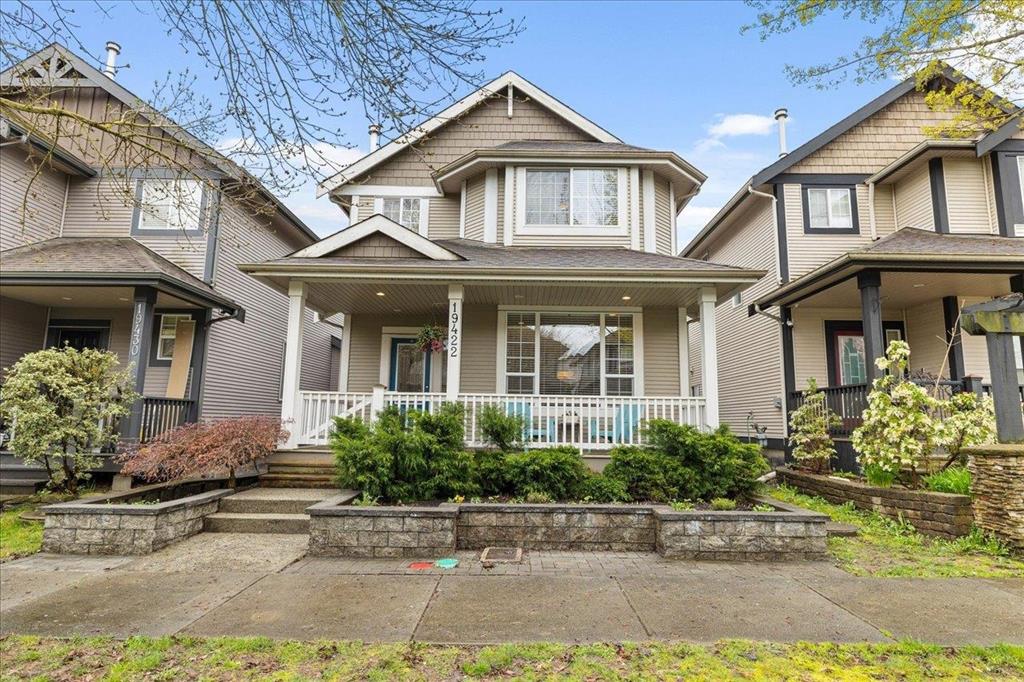
The 2010s and the pre-1980 homes both landed at 53%. So in Surrey, the newest and the oldest homes were the most likely to come off unsold. The 1980s and 2000s sat in the middle at 47% each, and the 1990s were the lowest of any era at 38%.
If you're buying a newer home in Surrey, this gives you something to work with. A lot of sellers in that group didn't get a deal done, which can mean more room to negotiate on the one you like.
The Trade-off: 60 listings is a fair sample, but not a big one, so a few houses either way can move the 62%. This is also a Surrey-wide figure. It doesn't tell you whether one neighbourhood did better or worse than another.
Langley (City & Township): The Pattern Flips
Langley came in at 40% overall, across 334 listings, the lowest of the 3 cities. The data can't split Langley City from the Township, so they're shown together.
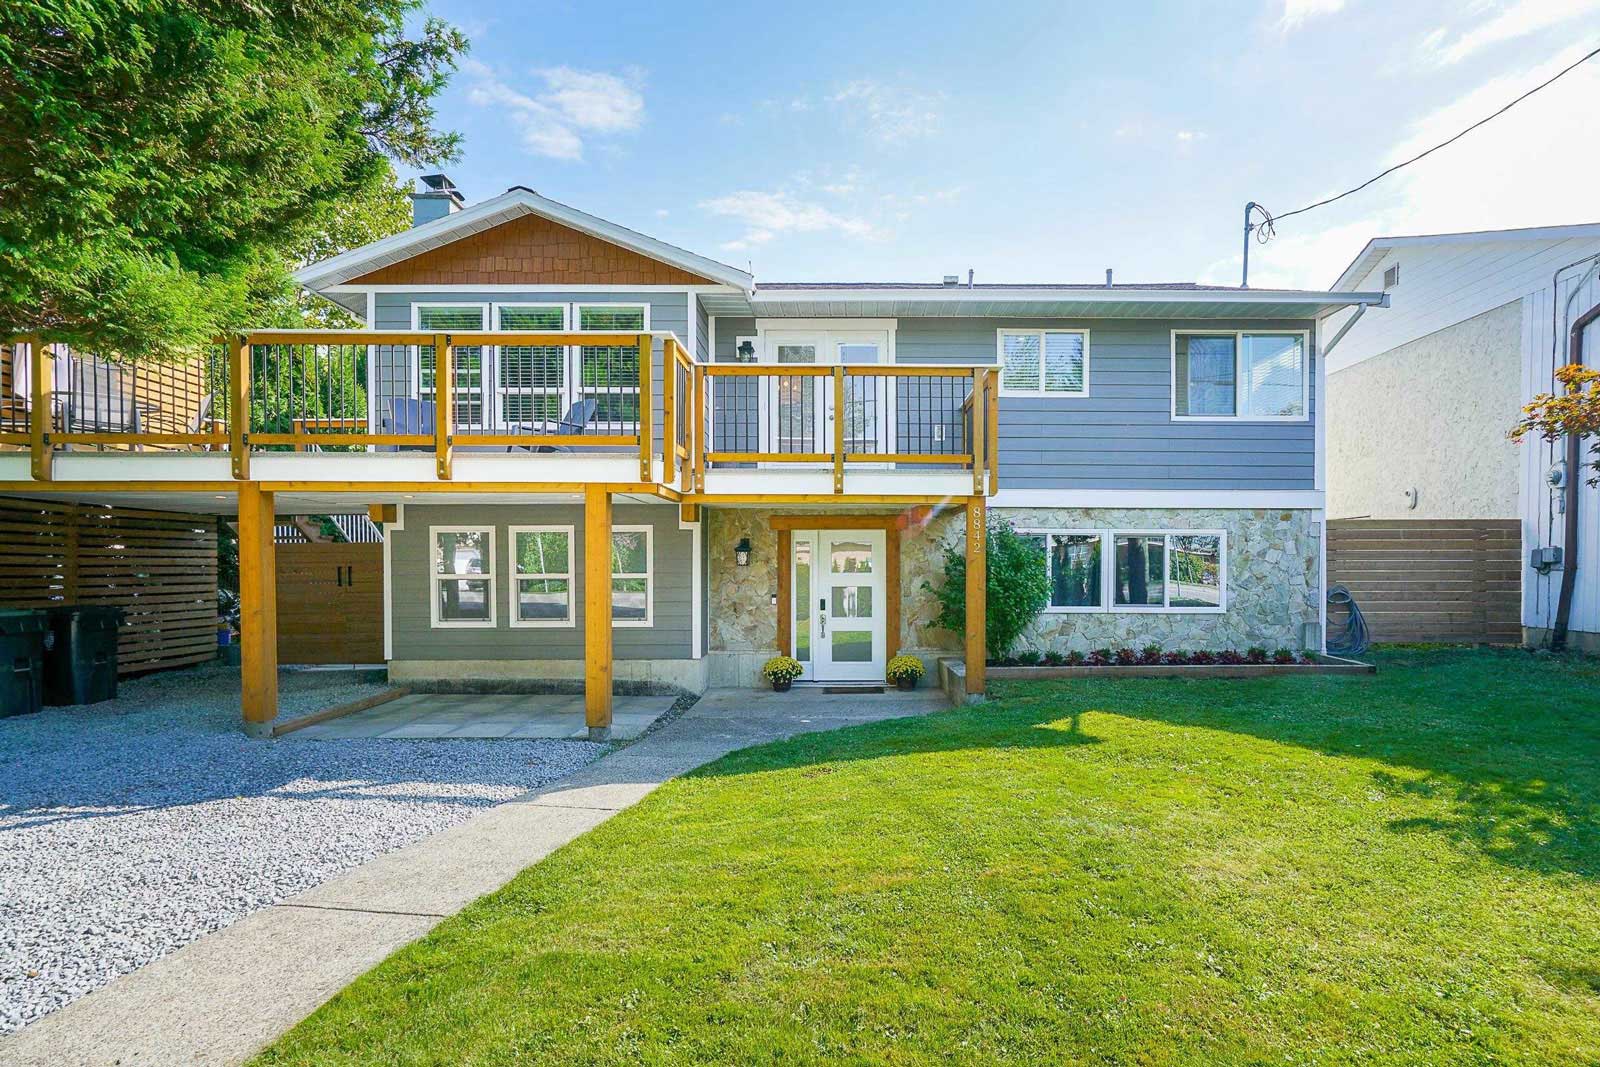
The new-home story turns around here. Langley homes built in 2020 or later came in at 37%, compared with 62% for the same era in Surrey. Same type of home, same 2 months, and a 25-point gap.
In Langley it was the oldest stock that sat the most. Homes built before 1980 came in at 47%. The 2000s (43%) and 2010s (45%) landed in between. At the low end, the 1980s came in at 33% and the 1990s at 35%.
The Trade-off: The 1980s and 1990s are 2 points apart, on 76 and 43 listings, so neither one is a clear winner. Several Langley eras rest on small groups, with the 2000s, 2010s and 2020s each between 35 and 38 listings, so a handful of houses can shift them a few points. And even at 37%, more than 1 in 3 of Langley's newest homes came off the market without a sale. Better than Surrey, but not easy.
Thinking About Buying or Selling?
The best first step is a quick conversation. Pick a time in the calendar that works for you and we'll talk it through.
Maple Ridge: The 1980s Stand Out
Maple Ridge came in at 46% overall, across 213 detached listings. What stands out here is the middle of the age range. Homes built in the 1980s came in at 59%, which is 35 of 59.
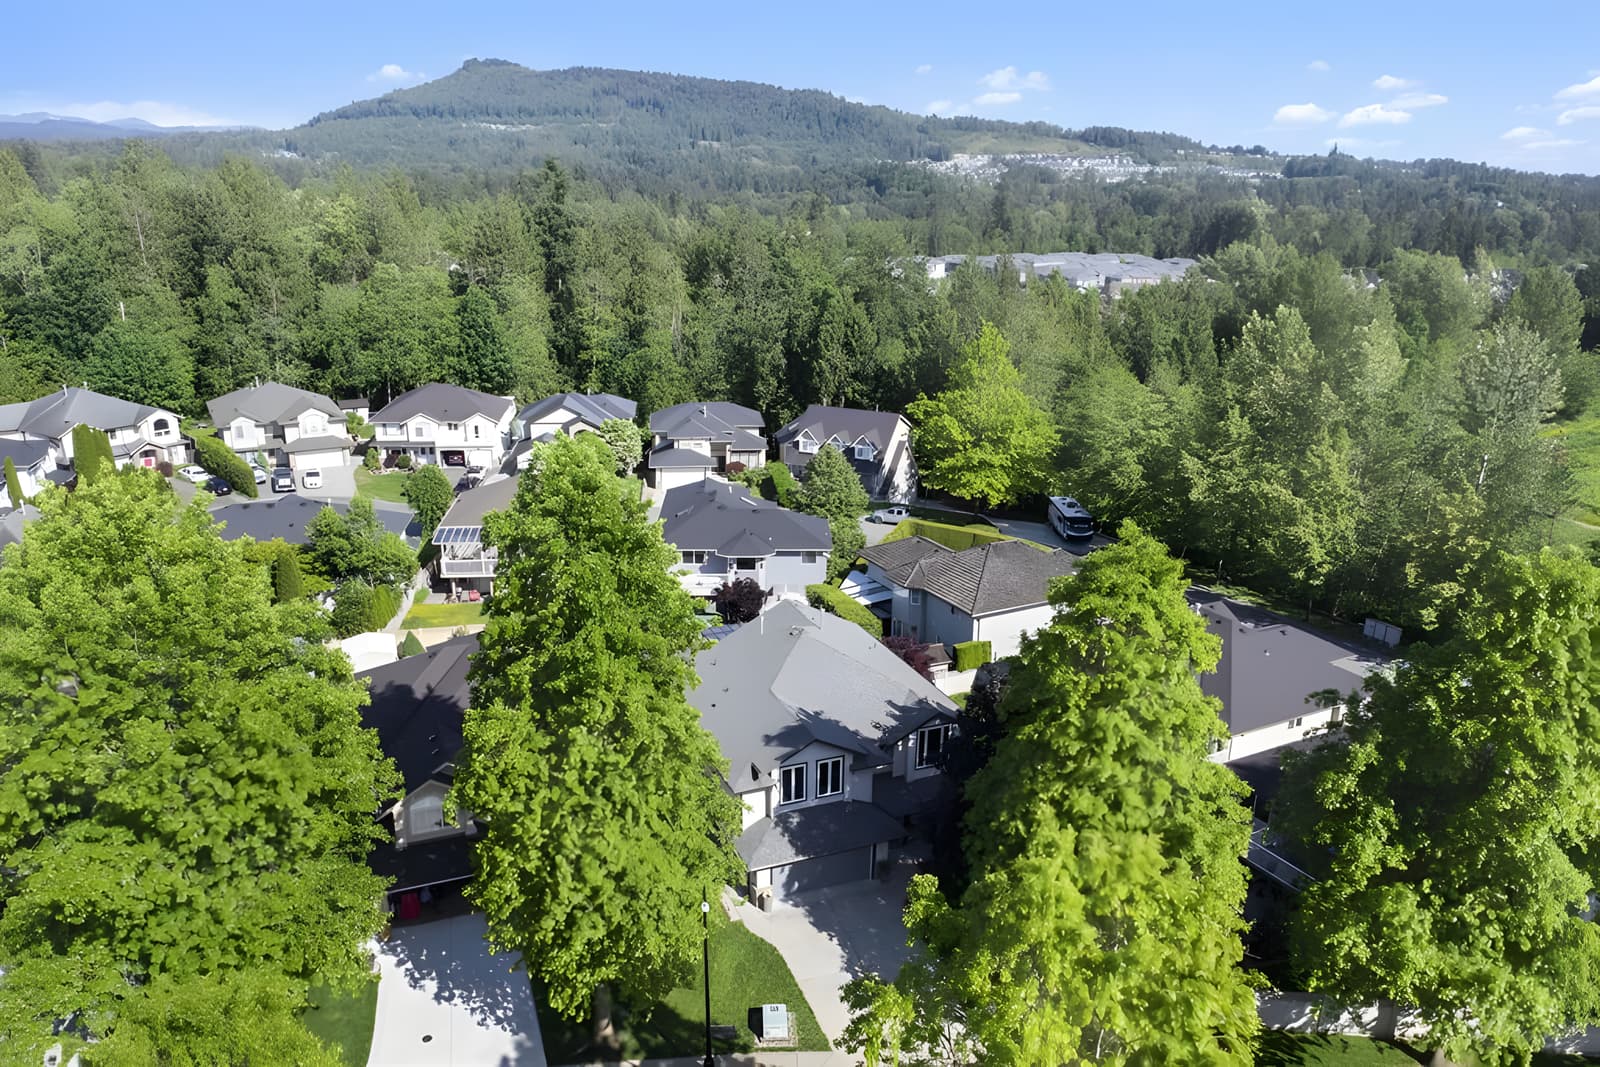
Put all 18 results side by side, 6 eras in each of 3 cities, and only one is higher than that: Surrey's 2020s homes at 62%.
The rest of Maple Ridge looked like this. Homes built before 1980 came in at 45%, the 2000s at 39% and the 2010s at 42%. The 1990s were the lowest at 32%. Homes built in 2020 or later came in at 47%, but that's only 19 listings, the smallest group in the whole table, so don't read much into it.
The Trade-off: If you're buying a 1980s home in Maple Ridge, this suggests there was room to negotiate in August and September. If you plan to sell again within a few years and want the easiest resale you can get, keep that 59% in mind. Like the other cities, it's a city-wide figure, and several Maple Ridge eras sit on 31 or fewer listings.
The 1990s: Lowest or Close to It in Every City
There's only one era that was the lowest, or within 2 points of the lowest, in all 3 cities: homes built in the 1990s.
- Surrey: 38%, the lowest of any era, on 136 listings.
- Maple Ridge: 32%, the lowest of any era, on 25 listings.
- Langley: 35%, 2 points from the 1980s at 33%.
Put another way, among homes that either sold or came off unsold, the 1990s homes had the best record of actually selling in Surrey and Maple Ridge, and they were close to the best in Langley. A reasonable read is that buyers and sellers of these homes were meeting on price more often.
A 1990s home is roughly 27 to 36 years old in 2026, so it's likely to need some updates. If that's the type of house you're looking at, get a proper inspection and budget for the bigger items, like a roof or windows, before you write an offer.
What This Means for You
If you're buying, the table tells you where sellers had a harder time getting a deal done in August and September 2026. In Surrey that's the newest homes. In Maple Ridge it's the 1980s. In Langley it's the pre-1980 homes. That doesn't make those houses bad buys. It means you may have more room to talk price.
You can browse what's for sale now in Surrey, Langley and Maple Ridge.
If you're selling, look at the row for your home's era and your city. If your group came off unsold often, pricing it off what a neighbour got a couple of years ago, or what you paid, is a risk worth thinking about before you list.
What This Data Can't Tell You
- It's a 2-month snapshot. It covers listings that left the market in August and September 2026, not a full year and not a trend.
- It's city-wide. It can't tell one neighbourhood from another.
- It's detached homes only. Townhomes and condos aren't in these figures.
- Not every listing that came off was a home nobody wanted. 349 of the 617 confirmed listings were Terminated or Cancel Protected, which includes sellers who chose to pull their listing.
- Some groups are small. Maple Ridge's 2020s homes (19 listings) are the smallest, and several other cells sit between 24 and 38 listings.
For the wider monthly picture, the Fraser Valley Real Estate Board's market report by municipality covers Surrey and Langley, and BCREA's statistical releases track sales across BC.
Want Help Reading This for Your Move?
If you're weighing a home in Surrey, Langley or Maple Ridge and want to know how its era and city stack up, book a call and we'll go through it together, based on what you're looking for and where you want to be.
Frequently Asked Questions
What does "came off the market without selling" mean here?
It means the listing expired or was withdrawn instead of selling. The status of each listing was checked in Paragon by MLS number. Listings that came off and went straight back on are left out.
Which city had the lowest share of detached listings come off the market without selling?
Langley (City & Township), at 40% of 334 listings. Maple Ridge came in at 46% of 213, and Surrey at 49% of 788.
Why did Surrey's newest homes come off unsold so often?
The data shows what happened, not why. Homes built in 2020 or later came in at 62% (37 of 60), the highest era in Surrey. One common reason any listing comes off unsold is that the seller and the market didn't agree on price, but this data doesn't break down the reasons.
Are 1990s homes a safer pick?
In August and September 2026, the 1990s were the lowest era in Surrey (38%) and Maple Ridge (32%), and 2 points from the lowest in Langley (35%). That's a strong showing over those 2 months. It isn't a promise about any one house, and a home of that age usually needs some updates.
Does a high number mean I shouldn't buy a home from that era?
No. It means more sellers in that group didn't get a deal done, which can give you more room to negotiate. The house itself still needs to be judged on its condition, location and price.
Is Langley City counted separately from the Township?
No. The data labels both as Langley, so they're shown together as Langley (City & Township).

Alex Dunbar Personal Real Estate Corporation
REAL Broker BC Ltd. | Living in the Lower Mainland
Buying, selling or investing in the Lower Mainland? Whether you're new to the area or a longtime local, I'll help you make the right move. Book a 30-minute no-pressure call with me and we'll go over your goals, timeline and budget.
Categories
Recent Posts





GET MORE INFORMATION