Greater Vancouver Housing Market Update: November 2026

by Alex Dunbar

November 2026 Market Update

Greater Vancouver Housing Market Update: November 2026
Sales fell 10.2% as Greater Vancouver buyers & sellers stepped back

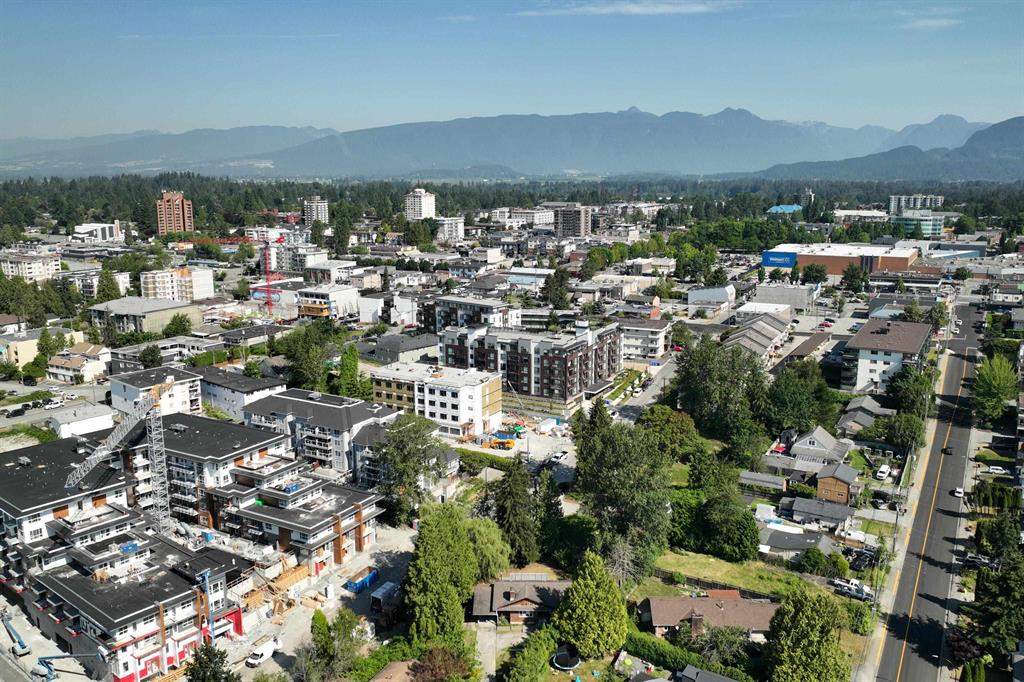
Photo: Downtown Maple Ridge

At A Glance

October 2026 Greater Vancouver Snapshot

Total Sales
2,024
-10.2% vs. October 2025
New Listings
4,805
-11.6% vs. October 2025
Active Inventory
15,688
+24% vs 10-year Avg
Sales-To-Active
13.4%
Balanced (Soft)
Composite Benchmark
$1,068,600
-5.2% vs. October 2025
Detached Benchmark
$1,775,200
-7.0% vs. October 2025
Townhome Benchmark
$1,006,500
-5.5% vs. October 2025
Condo Benchmark
$673,400
-5.9% vs. October 2025

Where The Market Sits

Sales-to-active listings ratio. Below 12% favours buyers, above 20% favours sellers.

13.4% Buyer's < 12% Balanced 12 to 20% Seller's > 20%

Snapshot Overview

Benchmark prices, monthly & annual movement, and sales activity side by side.

DetachedTownhomeCondo
Benchmark Price $1,775,200$1,006,500$673,400
vs. September 2026 -0.5%-1.0%-1.3%
vs. October 2025 -7.0%-5.5%-5.9%
Sales (Oct) 643468892
Sales vs. October 2025 -7.2%-1.9%-16.7%

12-Month Price Trend

Greater Vancouver aggregate. Click a property type below to switch chart, hover any data point for the exact monthly benchmark price.

$1,125,000$1,100,000$1,075,000$1,050,000Dec 2025Feb 2026Apr 2026Jun 2026Aug 2026Oct 2026 $1,123,700 November 2025 $1,114,800 December 2025 $1,101,900 January 2026 $1,100,300 February 2026 $1,104,300 March 2026 $1,098,000 April 2026 $1,100,700 May 2026 $1,081,900 August 2026 $1,075,900 September 2026 $1,068,600 October 2026
$1,925,000$1,900,000$1,875,000$1,850,000$1,825,000$1,800,000$1,775,000Dec 2025Feb 2026Apr 2026Jun 2026Aug 2026Oct 2026 $1,900,600 November 2025 $1,879,800 December 2025 $1,850,800 January 2026 $1,835,900 February 2026 $1,854,800 March 2026 $1,840,700 April 2026 $1,847,900 May 2026 $1,799,400 August 2026 $1,784,700 September 2026 $1,775,200 October 2026
$1,075,000$1,050,000$1,025,000$1,000,000Dec 2025Feb 2026Apr 2026Jun 2026Aug 2026Oct 2026 $1,065,600 November 2025 $1,056,600 December 2025 $1,043,400 January 2026 $1,046,100 February 2026 $1,047,100 March 2026 $1,043,400 April 2026 $1,048,200 May 2026 $1,028,800 August 2026 $1,016,700 September 2026 $1,006,500 October 2026
$725,000$700,000$675,000$650,000Dec 2025Feb 2026Apr 2026Jun 2026Aug 2026Oct 2026 $714,300 November 2025 $710,000 December 2025 $704,600 January 2026 $708,200 February 2026 $706,700 March 2026 $703,000 April 2026 $697,800 May 2026 $686,200 August 2026 $682,500 September 2026 $673,400 October 2026

With one quarter-point rate hike now behind us, and financial markets pricing in a slight chance of another quarter-point hike in December, it’s possible some buyers may step in to take advantage of rate holds that will soon be expiring.

Andrew Lis · Chief Economist & Vice-President Data Analytics, Greater Vancouver REALTORS
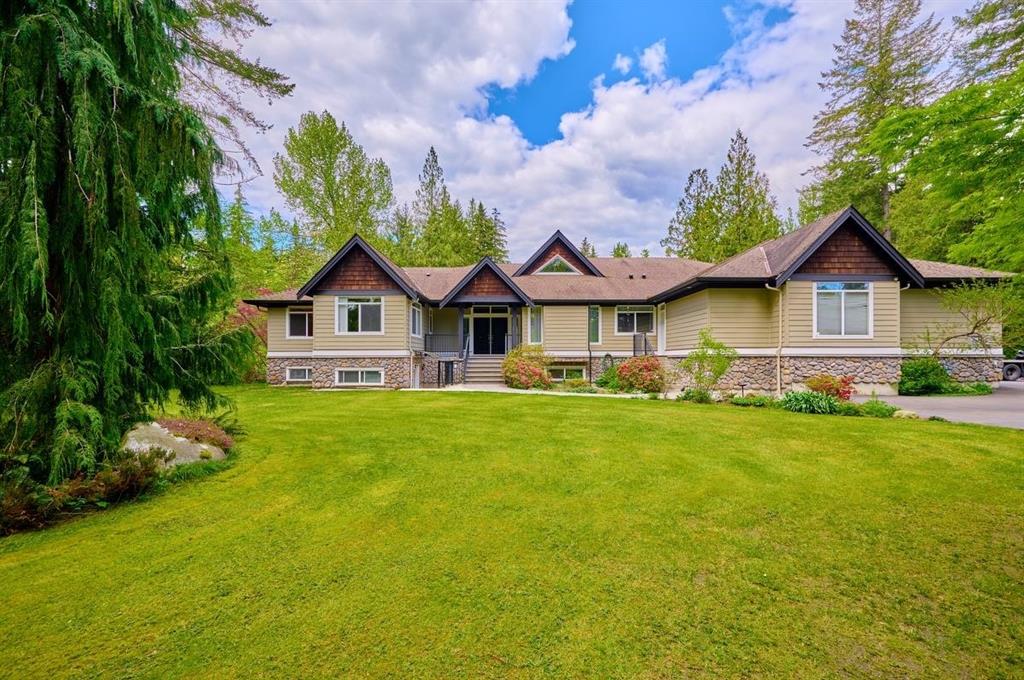
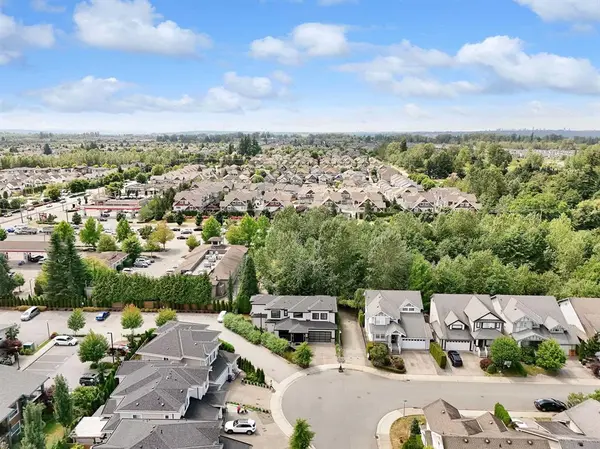
Detached home on an acreage lot in Maple Ridge
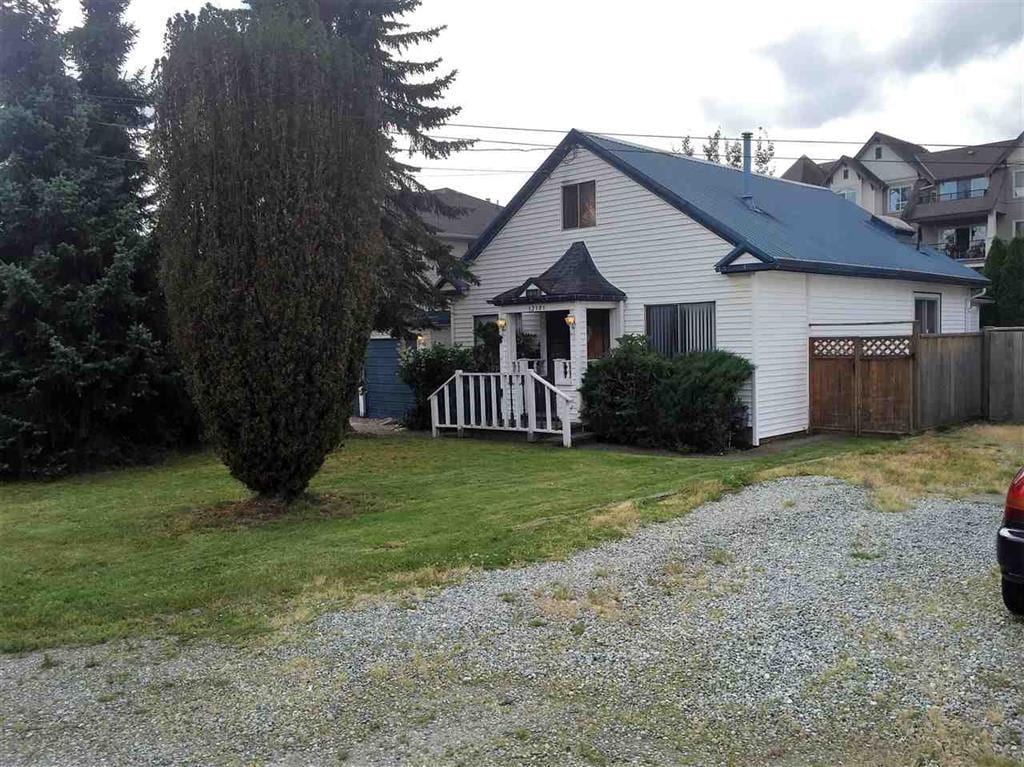
Older detached home in East Central Maple Ridge

By Area

Greater Vancouver Cities & Sub-Areas

Every sub-area in the Greater Vancouver report, with MLS Home Price Index benchmarks. Percentages below each price are vs. October 2025.

Bowen Island
$1,395,700
-0.5% vs. October 2025 composite
Detached
$1,398,200
Townhome
-
Condo
-
Sales-to-Active: -
6 Sales15 New Listings
Coquitlam
$957,500
-7.1% vs. October 2025 composite
Detached
$1,571,400
Townhome
$962,600
Condo
$624,200
Sales-to-Active: -
186 Sales424 New Listings
Maple Ridge
$864,000
-8.4% vs. October 2025 composite
Detached
$1,138,500
Townhome
$686,600
Condo
$481,600
Sales-to-Active: -
146 Sales286 New Listings
New Westminster
$707,200
-8.8% vs. October 2025 composite
Detached
$1,347,700
Townhome
$852,000
Condo
$565,900
Sales-to-Active: -
81 Sales200 New Listings
North Vancouver
$1,281,400
-2.7% vs. October 2025 composite
Detached
$2,058,800
Townhome
$1,221,100
Condo
$736,300
Sales-to-Active: -
167 Sales392 New Listings
Pitt Meadows
$832,600
-4.0% vs. October 2025 composite
Detached
$1,172,600
Townhome
$731,800
Condo
$523,500
Port Coquitlam
$840,200
-6.9% vs. October 2025 composite
Detached
$1,235,900
Townhome
$854,900
Condo
$551,200
Sales-to-Active: -
76 Sales136 New Listings
Port Moody
$995,800
-6.6% vs. October 2025 composite
Detached
$1,868,000
Townhome
$895,800
Condo
$680,000
Sales-to-Active: -
47 Sales125 New Listings
Richmond
$998,300
-8.3% vs. October 2025 composite
Detached
$1,833,100
Townhome
$1,009,300
Condo
$625,700
Sales-to-Active: -
251 Sales470 New Listings
Squamish
$1,100,500
-1.6% vs. October 2025 composite
Detached
$1,681,800
Townhome
$968,600
Condo
$599,600
Sales-to-Active: -
34 Sales97 New Listings
Sunshine Coast
$801,700
-1.8% vs. October 2025 composite
Detached
$850,200
Townhome
$708,600
Condo
$462,300
Sales-to-Active: -
38 Sales116 New Listings
Vancouver East
$1,121,600
-4.4% vs. October 2025 composite
Detached
$1,610,700
Townhome
$1,055,800
Condo
$635,100
Sales-to-Active: -
237 Sales634 New Listings
Vancouver West
$1,196,600
-4.5% vs. October 2025 composite
Detached
$2,899,700
Townhome
$1,285,000
Condo
$751,400
Sales-to-Active: -
334 Sales953 New Listings
West Vancouver
$2,299,200
-3.5% vs. October 2025 composite
Detached
$2,864,900
Townhome
-
Condo
$1,142,600
Sales-to-Active: -
42 Sales143 New Listings
Whistler
$1,359,000
-1.3% vs. October 2025 composite
Detached
$2,646,200
Townhome
$1,621,200
Condo
$612,500
Sales-to-Active: -
46 Sales100 New Listings
Burnaby
$940,967
-6.3% vs. October 2025 composite
Detached
$1,793,733
Townhome
$878,400
Condo
$691,900
Sales-to-Active: -
247 Sales582 New Listings
South Delta
$1,063,650
-4.0% vs. October 2025 composite
Detached
$1,366,000
Townhome
$893,850
Condo
$604,400
Sales-to-Active: -
55 Sales102 New Listings
AreaCompositeDetachedTownhomeCondo
Bowen Island$1,395,700-0.5%$1,398,200-0.6%--
Coquitlam$957,500-7.1%$1,571,400-7.0%$962,600-6.6%$624,200-9.1%
Maple Ridge$864,000-8.4%$1,138,500-8.6%$686,600-9.5%$481,600-8.3%
New Westminster$707,200-8.8%$1,347,700-9.9%$852,000-5.3%$565,900-9.2%
North Vancouver$1,281,400-2.7%$2,058,800-2.2%$1,221,100-5.9%$736,300-6.1%
Pitt Meadows$832,600-4.0%$1,172,600-1.3%$731,800-7.8%$523,500-8.0%
Port Coquitlam$840,200-6.9%$1,235,900-8.4%$854,900-3.3%$551,200-7.6%
Port Moody$995,800-6.6%$1,868,000-9.3%$895,800-10.1%$680,000-3.7%
Richmond$998,300-8.3%$1,833,100-11.1%$1,009,300-4.5%$625,700-8.8%
Squamish$1,100,500-1.6%$1,681,800+0.7%$968,600-6.2%$599,600-0.1%
Sunshine Coast$801,700-1.8%$850,200-2.1%$708,600-5.9%$462,300-5.4%
Vancouver East$1,121,600-4.4%$1,610,700-8.3%$1,055,800+0.4%$635,100-3.9%
Vancouver West$1,196,600-4.5%$2,899,700-9.0%$1,285,000-5.7%$751,400-3.8%
West Vancouver$2,299,200-3.5%$2,864,900-7.2%-$1,142,600+4.5%
Whistler$1,359,000-1.3%$2,646,200+2.2%$1,621,200-5.4%$612,500-4.8%
Burnaby$940,967-6.3%$1,793,733-7.7%$878,400-6.0%$691,900-6.9%
South Delta$1,063,650-4.0%$1,366,000-1.8%$893,850-8.8%$604,400-6.3%

* All percentage changes shown above are vs. October 2025 (Green = increase, Red = decrease)

Thinking About Buying or Selling in Maple Ridge?

The best first step is a quick conversation. Pick a time in the calendar that works for you and we'll talk it through.

Where the Deals Are

Best Deals for Buyers & Hot Pockets for Sellers

Every city gets a Buyer's Pick and a Seller's Pick for detached homes and for attached homes (townhomes and condos). The bar beside each city shows its sales ratio: below 12% favours buyers, above 20% favours sellers.

Buyer's Pick
Where buyers have the most room to negotiate.
Seller's Pick
What's still selling fastest, and at what price.
Burnaby
Detached
12% Balanced Market
Attached
13% Balanced Market
Buyer's Pick
Detached
Price: $2,750,000 to $3,500,000
Areas: Burnaby Hospital, Government Road, Metrotown, Parkcrest and Willingdon
Signal: Homes selling 4% below list on average
Attached
Price: $1,250,000 to $1,500,000
Areas: Capitol Hill, Central Park, Simon Fraser Hills, SFU and Vancouver Heights
Signal: Homes selling 2% below list on average
Seller's Pick
Detached
Price: $1,500,000 to $1,750,000
Areas: Brentwood Park, Upper Deer Lake and Vancouver Heights
Size: 2 bedrooms or fewer
Signal: 25% sales ratio in that price band, vs 12% overall
Attached
Price: $400,000 to $500,000
Areas: Highgate, Montecito and South Slope
Size: 3 bedrooms or fewer
Signal: 20% sales ratio in that price band, vs 13% overall
Coquitlam
Detached
14% Balanced Market
Attached
16% Balanced Market
Buyer's Pick
Detached
Price: $2,750,000 to $3,000,000
Areas: Canyon Springs, Coquitlam West and Maillardville
Size: 7+ bedrooms
Signal: Homes selling 2% below list on average
Attached
Price: $1,000,000 to $1,500,000
Areas: Central Coquitlam
Size: 2 bedrooms or fewer
Signal: Homes selling 2% below list on average
Seller's Pick
Detached
Price: $1,000,000 to $1,250,000
Areas: Ranch Park
Size: 3 to 4 bedrooms
Signal: 36% sales ratio in that price band, vs 14% overall
Attached
Price: $300,000 to $400,000
Areas: Burke Mountain, Coquitlam East, Eagle Ridge and New Horizons
Size: 4+ bedrooms
Signal: 33% sales ratio in that price band, vs 16% overall
Downtown
Attached
11% Buyers Market
Buyer's Pick
Detached
No data this month
Attached
Price: $1,500,000 to $2,000,000
Areas: Coal Harbour and Westend
Size: 3 bedrooms
Signal: Homes selling 5% below list on average
Seller's Pick
Detached
No data this month
Attached
Price: $300,000 to $400,000
Areas: Downtown and Yaletown
Size: 2 bedrooms or fewer
Signal: 22% sales ratio in that price band, vs 11% overall
Eastside
Detached
14% Balanced Market
Attached
14% Balanced Market
Buyer's Pick
Detached
Price: $2,750,000 to $3,000,000
Areas: Collingwood, Mount Pleasant, Renfrew Heights and South Vancouver
Signal: Homes selling 2% below list on average
Attached
Price: $900,000 to $1,000,000
Areas: Downtown, Renfrew Heights, Renfrew and Strathcona
Size: 4+ bedrooms
Signal: Homes selling 3% below list on average
Seller's Pick
Detached
Price: $1,000,000 to $1,250,000
Areas: Fraser and Hastings Sunrise
Size: 3 to 4 bedrooms
Signal: 39% sales ratio in that price band, vs 14% overall
Attached
Price: $1,250,000 to $1,500,000
Areas: Grandview Woodland, Knight, Main and Victoria
Size: 2 bedrooms
Signal: 24% sales ratio in that price band, vs 14% overall
Ladner
Detached
12% Balanced Market
Attached
15% Balanced Market
Buyer's Pick
Detached
Price: $1,250,000 to $1,500,000
Areas: Holly
Size: 3 to 4 bedrooms
Signal: Homes selling 7% below list on average
Attached
Price: $800,000 to $900,000
Areas: Hawthorne
Signal: Homes selling 4% below list on average
Seller's Pick
Detached
Price: $1,000,000 to $1,250,000
Areas: Hawthorne
Size: 5 to 6 bedrooms
Signal: 29% sales ratio in that price band, vs 12% overall
Attached
Price: $400,000 to $500,000
Areas: Neilsen Grove
Size: 3 bedrooms or fewer
Signal: 22% sales ratio in that price band, vs 15% overall
Maple Ridge
Detached
15% Balanced Market
Attached
17% Balanced Market
Buyer's Pick
Detached
Price: $1,500,000 to $1,750,000
Areas: Silver Valley and West Central
Size: 2 bedrooms or fewer, or 7+ bedrooms
Signal: Homes selling 4% below list on average
Attached
Price: $800,000 to $900,000
Areas: Southwest and West Central
Size: 1 bedroom or studio
Signal: Homes selling 3% below list on average
Seller's Pick
Detached
Price: $800,000 to $900,000
Areas: Albion and Cottonwood
Size: 3 to 4 bedrooms
Signal: 39% sales ratio in that price band, vs 15% overall
Attached
Price: $300,000 to $400,000
Areas: Albion and East Central
Size: 2 bedrooms
Signal: 28% sales ratio in that price band, vs 17% overall
New Westminster
Detached
10% Buyers Market
Attached
16% Balanced Market
Buyer's Pick
Detached
Price: $1,500,000 to $1,750,000
Areas: Queensborough, Uptown and West End
Size: 7+ bedrooms
Signal: Homes selling 4% below list on average
Attached
Price: $400,000 to $500,000 or $700,000 to $800,000
Areas: Queensborough and Sapperton
Signal: 16% sales ratio overall
Seller's Pick
Detached
Price: $1,250,000 to $1,500,000
Areas: GlenBrooke North
Size: 3 to 4 bedrooms
Signal: 19% sales ratio in that price band, vs 10% overall
Attached
Price: $300,000 to $400,000
Areas: GlenBrooke North and Uptown
Size: 2 bedrooms
Signal: 26% sales ratio in that price band, vs 16% overall
North Vancouver
Detached
20% Balanced Market
Attached
16% Balanced Market
Buyer's Pick
Detached
Price: $2,000,000 to $2,250,000
Areas: Boulevard, Canyon H., Central Lonsdale, Upper Delbrook and Westlynn Terrace
Signal: Homes selling 5% below list on average
Attached
Price: $1,500,000 to $1,750,000
Areas: Harbourside
Size: 4+ bedrooms
Signal: Homes selling 3% below list on average
Seller's Pick
Detached
Price: $1,250,000 to $1,500,000
Areas: Blueridge, Deep Cove, Dollarton, Lynn Valley and Pemberton Heights
Size: 3 to 4 bedrooms
Signal: 33% sales ratio in that price band, vs 20% overall
Attached
Price: $400,000 to $600,000
Areas: Central Lonsdale, Indian River, Lynn Valley and Roche Point
Size: 3 bedrooms or fewer
Signal: 29% sales ratio in that price band, vs 16% overall
Pitt Meadows
Detached
31% Sellers Market
Attached
43% Sellers Market
Buyer's Pick
Detached
Price: $1,250,000 to $1,500,000
Areas: South Meadows
Signal: Homes selling 2% below list on average
Attached
Price: $700,000 to $800,000
Areas: Central Meadows and Mid Meadows
Signal: Homes selling 1% below list on average
Seller's Pick
Detached
Price: $1,000,000 to $1,250,000
Areas: Central Meadows
Size: 3 to 4 bedrooms
Signal: 60% sales ratio in that price band, vs 31% overall
Attached
Price: $500,000 to $600,000
Areas: South Meadows
Size: 2 to 3 bedrooms
Signal: 50% sales ratio in that price band, vs 43% overall
Port Coquitlam
Detached
14% Balanced Market
Attached
24% Sellers Market
Buyer's Pick
Detached
Price: $1,250,000 to $1,500,000
Areas: Glenwood
Size: 5 to 6 bedrooms
Signal: Homes selling 6% below list on average
Attached
Price: $400,000 to $500,000
Areas: Central Port Coquitlam
Size: 1 bedroom or studio
Signal: Homes selling 1% below list on average
Seller's Pick
Detached
Price: $1,000,000 to $1,250,000
Areas: Lincoln Park, Mary Hill, Oxford Heights, Riverwood and Woodland Acres
Size: 3 to 4 bedrooms
Signal: 26% sales ratio in that price band, vs 14% overall
Attached
Price: $800,000 to $900,000
Areas: Citadel, Glenwood and Riverwood
Size: 4+ bedrooms
Signal: 50% sales ratio in that price band, vs 24% overall
Port Moody
Detached
9% Buyers Market
Attached
20% Balanced Market
Buyer's Pick
Detached
Price: $1,750,000 to $2,000,000
Areas: Heritage Woods and North Shore
Size: 5 to 6 bedrooms
Signal: 9% sales ratio overall
Attached
Price: $600,000 to $700,000
Areas: College Park and Port Moody Centre
Size: 2 bedrooms or fewer
Signal: Homes selling 3% below list on average
Seller's Pick
Detached
Price: $1,250,000 to $1,500,000
Areas: College Park and Glenayre
Size: 3 to 4 bedrooms
Signal: 31% sales ratio in that price band, vs 9% overall
Attached
Price: $800,000 to $900,000
Areas: North Shore
Size: 3+ bedrooms
Signal: 38% sales ratio in that price band, vs 20% overall
Richmond
Detached
10% Buyers Market
Attached
16% Balanced Market
Buyer's Pick
Detached
Price: $3,000,000 to $3,500,000
Areas: Garden City, Hamilton, McNair, Saunders and Seafair
Size: 5+ bedrooms
Signal: Homes selling 6% below list on average
Attached
Price: $1,500,000 to $1,750,000
Areas: Boyd Park, Bridgeport and Granville
Size: 2 bedrooms or fewer
Signal: Homes selling 4% below list on average
Seller's Pick
Detached
Price: $1,000,000 to $1,250,000
Areas: Boyd Park, East Cambie, Lackner, Quilchena, Steveston North and West Cambie
Size: 3 to 4 bedrooms
Signal: 38% sales ratio in that price band, vs 10% overall
Attached
Price: $500,000 to $600,000
Areas: East Cambie, McLennan North, Quilchena and Steveston South
Size: 3+ bedrooms
Signal: 30% sales ratio in that price band, vs 16% overall
Tsawwassen
Detached
15% Balanced Market
Attached
13% Balanced Market
Buyer's Pick
Detached
Price: $1,250,000 to $1,500,000 or $1,750,000 to $2,000,000
Areas: Cliff Drive, Pebble Hill and Tsawwassen East & North
Signal: Homes selling 3% below list on average
Attached
Price: $500,000 to $600,000
Areas: Tsawwassen Central
Size: 1 bedroom or studio
Signal: Homes selling 1% below list on average
Seller's Pick
Detached
Price: $1,000,000 to $1,250,000
Areas: Beach Grove and Tsawwassen Central
Size: 3 to 4 bedrooms
Signal: 36% sales ratio in that price band, vs 15% overall
Attached
Price: $700,000 to $800,000
Areas: Boundary Beach
Size: 2 bedrooms
Signal: 33% sales ratio in that price band, vs 13% overall
West Vancouver
Detached
8% Buyers Market
Attached
6% Buyers Market
Buyer's Pick
Detached
Price: $2,500,000 to $2,750,000
Areas: Caulfield, Cypress Park Estates and Lions Bay
Signal: Homes selling 3% below list on average
Attached
Price: $1,750,000 to $2,000,000
Areas: Dundarave and Horseshoe Bay
Size: 3 bedrooms
Signal: Homes selling 5% below list on average
Seller's Pick
Detached
Price: $1,500,000 to $1,750,000
Areas: Eagle Harbour and Horseshoe Bay
Size: 3+ bedrooms
Signal: 17% sales ratio in that price band, vs 8% overall
Attached
Price: $1,000,000 to $1,250,000
Areas: Panorama Village
Size: 2 bedrooms
Signal: 15% sales ratio in that price band, vs 6% overall
Westside
Detached
10% Buyers Market
Attached
14% Balanced Market
Buyer's Pick
Detached
Price: $4,000,000 to $4,500,000
Areas: Kerrisdale, Point Grey, Quilchena, Shaughnessy, South Granville and University
Signal: Homes selling 5% below list on average
Attached
Price: $2,000,000 to $2,250,000
Areas: Marpole, SW Marine, Shaughnessy, South Cambie & Granville and University
Signal: Homes selling 3% below list on average
Seller's Pick
Detached
Price: $1,750,000 to $2,000,000
Areas: SW Marine
Size: 3 to 4 bedrooms
Signal: 30% sales ratio in that price band, vs 10% overall
Attached
Price: $400,000 to $500,000
Areas: Fairview and Mount Pleasant
Size: 2 bedrooms
Signal: 24% sales ratio in that price band, vs 14% overall

Here's the short version: buyers and sellers both stepped back in October. Sales and new listings each fell about a tenth from last year, prices kept easing, and the market stayed in balanced territory, just barely. If you're watching Maple Ridge, prices there fell faster than the region as a whole, which matters whether you're buying or selling.

Every figure here comes from the Greater Vancouver REALTORS October 2026 Statistics Package, released November 2, 2026. The GVR area includes Vancouver, Burnaby, Coquitlam, Richmond, North Vancouver, Maple Ridge, Pitt Meadows and more.

What Changed In October

  • •Fewer sales across the board: GVR October 2026 sales of 2,024 were 10.2% below October 2025. Apartment sales fell the most, down 16.7% to 892. Detached sales fell 7.2% to 643 and attached sales fell 1.9% to 468.
  • •Fewer new listings too: 4,805 new GVR listings in October 2026 is 11.6% below October 2025, so sellers pulled back as much as buyers did.
  • •Inventory is still high: 15,688 active GVR listings at the end of October 2026 is 24.0% above the 10-year seasonal average, even after a 4.3% drop from October 2025.
  • •Prices still easing: The GVR composite Benchmark fell 0.7% from September 2026. Detached is down 7.0% from October 2025, the biggest drop of the 3 property types.

Benchmark Prices By Property Type

Property TypeBenchmark Pricevs. September 2026vs. October 2025
Single-Family Detached$1,775,200-0.5%-7.0%
Townhome$1,006,500-1.0%-5.5%
Apartment / Condo$673,400-1.3%-5.9%

The Benchmark price is the value of a typical home in each category. It filters out the swings you get from individual sales, so it's a cleaner read on direction than an average.

Maple Ridge In October 2026

Maple Ridge is part of the GVR area, not the Fraser Valley board, so it's covered here rather than in the Fraser Valley update.

Property TypeBenchmark Pricevs. September 2026vs. October 2025
Composite$864,000-2.1%-8.4%
Single-Family Detached$1,138,500-1.5%-8.6%
Townhome$686,600-2.0%-9.5%
Apartment / Condo$481,600-6.2%-8.3%
  • •Prices fell faster than the region: The Maple Ridge composite Benchmark dropped 8.4% from October 2025, compared with 5.2% for Greater Vancouver as a whole.
  • •Condos had a sharp month: The Maple Ridge apartment Benchmark fell 6.2% from September 2026 alone.
  • •Detached sales picked up: GVR reports 79 detached sales in Maple Ridge and Pitt Meadows combined in October 2026, up from 70 in October 2025 and 58 in September 2026. The board reports Maple Ridge and Pitt Meadows sales together.
  • •Townhome sales slowed: Maple Ridge and Pitt Meadows attached sales were 35 in October 2026, down from 44 in October 2025.
  • •Balanced on the ground: SnapStats' October 2026 Maple Ridge report, captured November 1, shows 59 detached sales against 388 detached listings (a 15.2% sales ratio) and 46 attached sales against 268 attached listings (17.2%). Both sit inside the balanced range.

What This Means If You're Buying

In Greater Vancouver overall, you're in a soft balanced market. At a 13.4% sales-to-active ratio in October 2026 there's plenty of choice, and GVR's chief economist noted that prices have edged lower through the year. The catch is borrowing costs. GVR pointed to the Bank of Canada's quarter-point rate hike in October, so a lower price doesn't automatically mean a lower monthly payment. Refresh your pre-approval and run the payment at today's rate before you write an offer.

In Maple Ridge, prices have come down further than the regional average. A detached Benchmark home is $107,100 cheaper than in October 2025 on the GVR index. Detached sales are picking up, though, so the best-priced homes won't sit forever.

What This Means If You're Selling

Price to this month's sales, not last year's. Every Maple Ridge Benchmark is lower than October 2025, and buyers will have those comparables in front of them.

If you own a detached home in Maple Ridge, you're in the segment where sales are rising, which puts you in a better spot than condo and townhome sellers. If you're selling a condo, the 6.2% drop in the Maple Ridge apartment Benchmark from September 2026 is a reason to get your pricing right from day one rather than chase the market down.

Is Greater Vancouver a buyer's or seller's market in October 2026? Balanced, at the soft end. The GVR sales-to-active ratio for October 2026 was 13.4%, inside the 12% to 20% balanced range.

What is the Benchmark price for a Greater Vancouver detached home in October 2026? $1,775,200 in October 2026, according to GVR. That's down 0.5% from September 2026 and 7.0% from October 2025.

What is the Benchmark price for a Maple Ridge detached home in October 2026? $1,138,500 in October 2026, according to GVR. That's down 1.5% from September 2026 and 8.6% from October 2025.

How many homes sold in Greater Vancouver in October 2026? 2,024 homes sold in October 2026, according to GVR, down 10.2% from October 2025.

Are Maple Ridge home prices going up or down? Down. The GVR composite Benchmark for Maple Ridge was $864,000 in October 2026, 2.1% below September 2026 and 8.4% below October 2025.

Frequently Asked Questions

Is Greater Vancouver a buyer's or seller's market in October 2026?

Balanced, at the soft end. The GVR sales-to-active ratio for October 2026 was 13.4%, inside the 12% to 20% balanced range.

What is the Benchmark price for a Greater Vancouver detached home in October 2026?

$1,775,200 in October 2026, according to GVR. That's down 0.5% from September 2026 and 7.0% from October 2025.

What is the Benchmark price for a Maple Ridge detached home in October 2026?

$1,138,500 in October 2026, according to GVR. That's down 1.5% from September 2026 and 8.6% from October 2025.

How many homes sold in Greater Vancouver in October 2026?

2,024 homes sold in October 2026, according to GVR, down 10.2% from October 2025.

Are Maple Ridge home prices going up or down?

Down. The GVR composite Benchmark for Maple Ridge was $864,000 in October 2026, 2.1% below September 2026 and 8.4% below October 2025.

Alex Dunbar, REALTOR with REAL Broker BC Ltd., serving Surrey, Langley and Maple Ridge

Alex Dunbar Personal Real Estate Corporation

REAL Broker BC Ltd.  |  Living in the Lower Mainland

Buying, selling or investing in the Lower Mainland? Whether you're new to the area or a longtime local, I'll help you make the right move. Book a 30-minute no-pressure call with me and we'll go over your goals, timeline and budget.

Source: Greater Vancouver REALTORS®, October 2026 Statistics Package, released November 3, 2026. Sub-market insights from SnapStats®. Prices are MLS Home Price Index benchmarks. Commission rates are negotiable, please contact a REALTOR® for a quote on your specific situation.

GET MORE INFORMATION

Alex Dunbar

Alex Dunbar

Real Estate Agent

+1(604) 314-5418

Name
Phone*
Message