
Surrey, Langley & Maple Ridge Market Update: November 2026
Prices fell year over year in all 12 of the area and home type combinations I track in Surrey, Langley and Maple Ridge, but they didn't fall evenly, and the buyer-versus-seller balance looks very different depending on where you're shopping. Townhomes in both the Township of Langley and the City of Langley are moving quickly. Surrey condos and detached homes are not. Maple Ridge has the lowest prices of the 4 areas for detached homes and townhomes, and the steadiest balance.
Everything below is built from FVREB's October 2026 data, which is why this update is named for November, the month it's published. Prices are MLS® Home Price Index Benchmarks, which is FVREB's price for a typical home in each category. They aren't an average of what sold, so they won't match a headline from another source. I show the Township of Langley and the City of Langley separately because FVREB reports them as separate areas.
October 2026 at a Glance
| Area | Type | Benchmark | YoY | Sales Ratio | Days On Market |
|---|---|---|---|---|---|
| Surrey | Detached | $1,380,100 | -7.7% | 11.4% | 32 |
| Surrey | Townhome | $757,300 | -5.5% | 14.4% | 25 |
| Surrey | Condo | $443,900 | -9.6% | 9.5% | 24 |
| Township of Langley | Detached | $1,448,100 | -6.5% | 13.5% | 19 |
| Township of Langley | Townhome | $800,600 | -3.7% | 29.2% | 23 |
| Township of Langley | Condo | $522,300 | -8.4% | 14.7% | 34 |
| City of Langley | Detached | $1,165,000 | -1.4% | 7.9% | 33 |
| City of Langley | Townhome | $733,700 | -6.1% | 33.3% | 23 |
| City of Langley | Condo | $461,400 | -10.9% | 16.0% | 27 |
| Maple Ridge | Detached | $1,138,500 | -8.6% | 15.5% | 33 |
| Maple Ridge | Townhome | $686,600 | -9.5% | 15.8% | 31 |
| Maple Ridge | Condo | $481,600 | -8.2% | 17.6% | 33 |
YoY compares the October 2026 Benchmark with October 2025. The Sales Ratio is sales divided by active listings for the month.
How to Read the Sales Ratio
The sales ratio is the quickest way to tell who has the leverage. FVREB treats 12.0% to 20.0% as a balanced market. Below 12.0%, there are more homes for sale than buyers to absorb them, and buyers usually have room to negotiate. Above 20.0%, buyers are competing for a thin supply and sellers have the upper hand.
Prices and ratios can point in different directions. A category can have a falling Benchmark and a rising sales ratio at the same time, which usually means buyers are returning after a price reset but haven't used up the supply yet.
Surrey: Condos & Detached Homes Soften
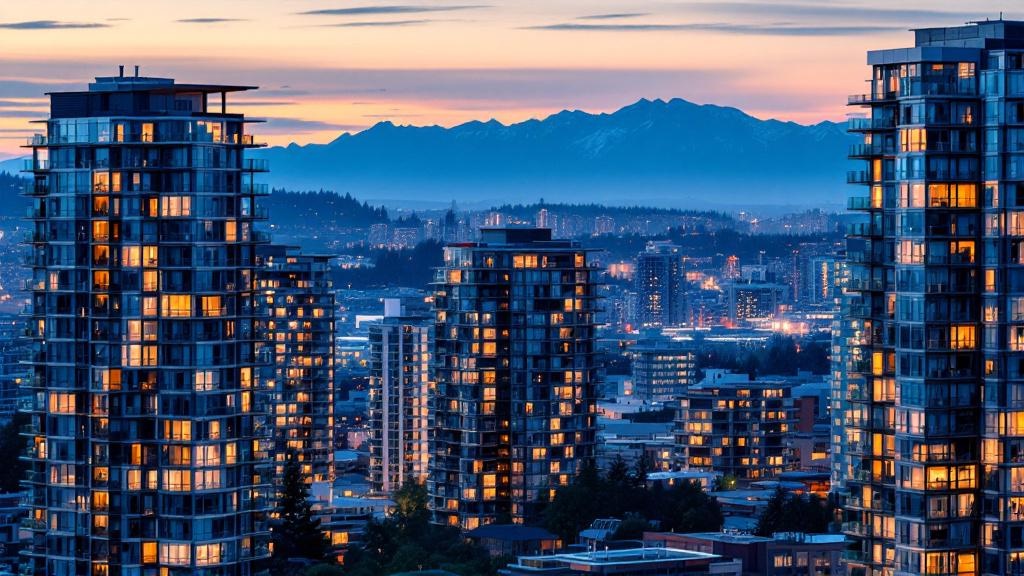
Surrey detached homes had a Benchmark of $1,380,100 in October 2026, which is 7.7% lower than October 2025 and $115,200 less in dollar terms. The sales ratio of 11.4% sits just under the balanced range, though it improved from 9.6% a year earlier. Homes took 32 days on market, 4 days longer than last October.
Townhomes held up better. The Benchmark of $757,300 is down 5.5% year over year, and the sales ratio of 14.4% is inside the balanced range. At 25 days on market, they're moving 2 days faster than a year ago, even though the ratio itself slipped from 16.9%.
Condos are where Surrey is weakest. The Benchmark of $443,900 is down 9.6% from last October, and a sales ratio of 9.5% is the lowest of the 3 Surrey types. If you're buying a condo in Surrey, you have the most negotiating room of any category I'm covering here, apart from City of Langley detached homes. Check the strata documents carefully, because a falling price and a rising strata fee can cancel each other out.
Township of Langley: Townhomes Stand Out
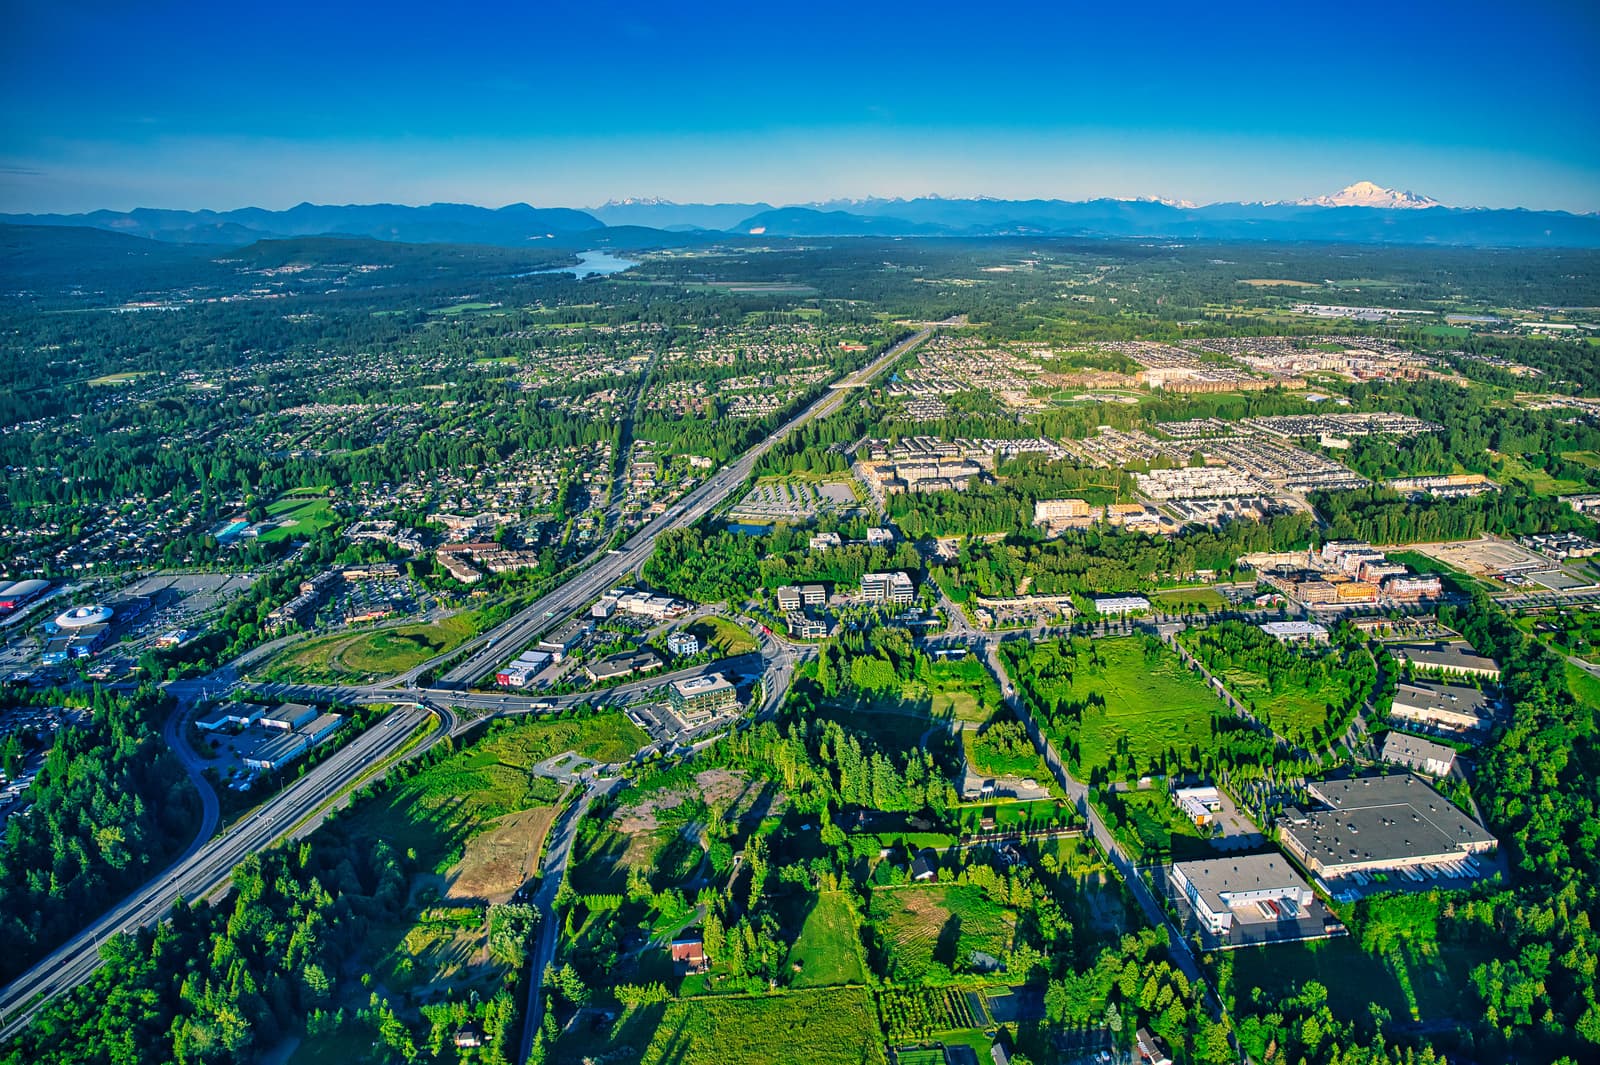
Township of Langley townhomes are the strongest category in the Township. The Benchmark of $800,600 is down only 3.7% year over year, and the sales ratio jumped to 29.2% from 22.5% a year ago, well above the 20.0% line. Homes took 23 days on market. If you're buying a Township townhome, expect competition on well-priced listings and be ready to move.
Township detached homes are more balanced. The Benchmark is $1,448,100, down 6.5% from October 2025, and the sales ratio of 13.5% is inside the balanced range, although it's lower than the 16.2% from last year. At 19 days on market, this was the fastest-moving detached category of the 4 areas.
Township condos need a closer read. The Benchmark of $522,300 is down 8.4% year over year, and the sales ratio of 14.7% is balanced. But days on market rose to 34 from 18 a year ago, which means homes are sitting longer even though the ratio looks healthy. When a ratio and the days on market disagree, I trust the days on market for how your own listing or offer will play out, because it measures how long real homes are taking to sell.
These are FVREB's figures for its Langley area (F60), shown here as the Township of Langley because the City has its own FVREB area (F6A). Thin segments can swing a lot from one month to the next, so don't read a single month as a trend.
Tools & Resources
Looking at one of these areas more closely? Start with the relocation guides.
City of Langley: Small Market, Big Swings
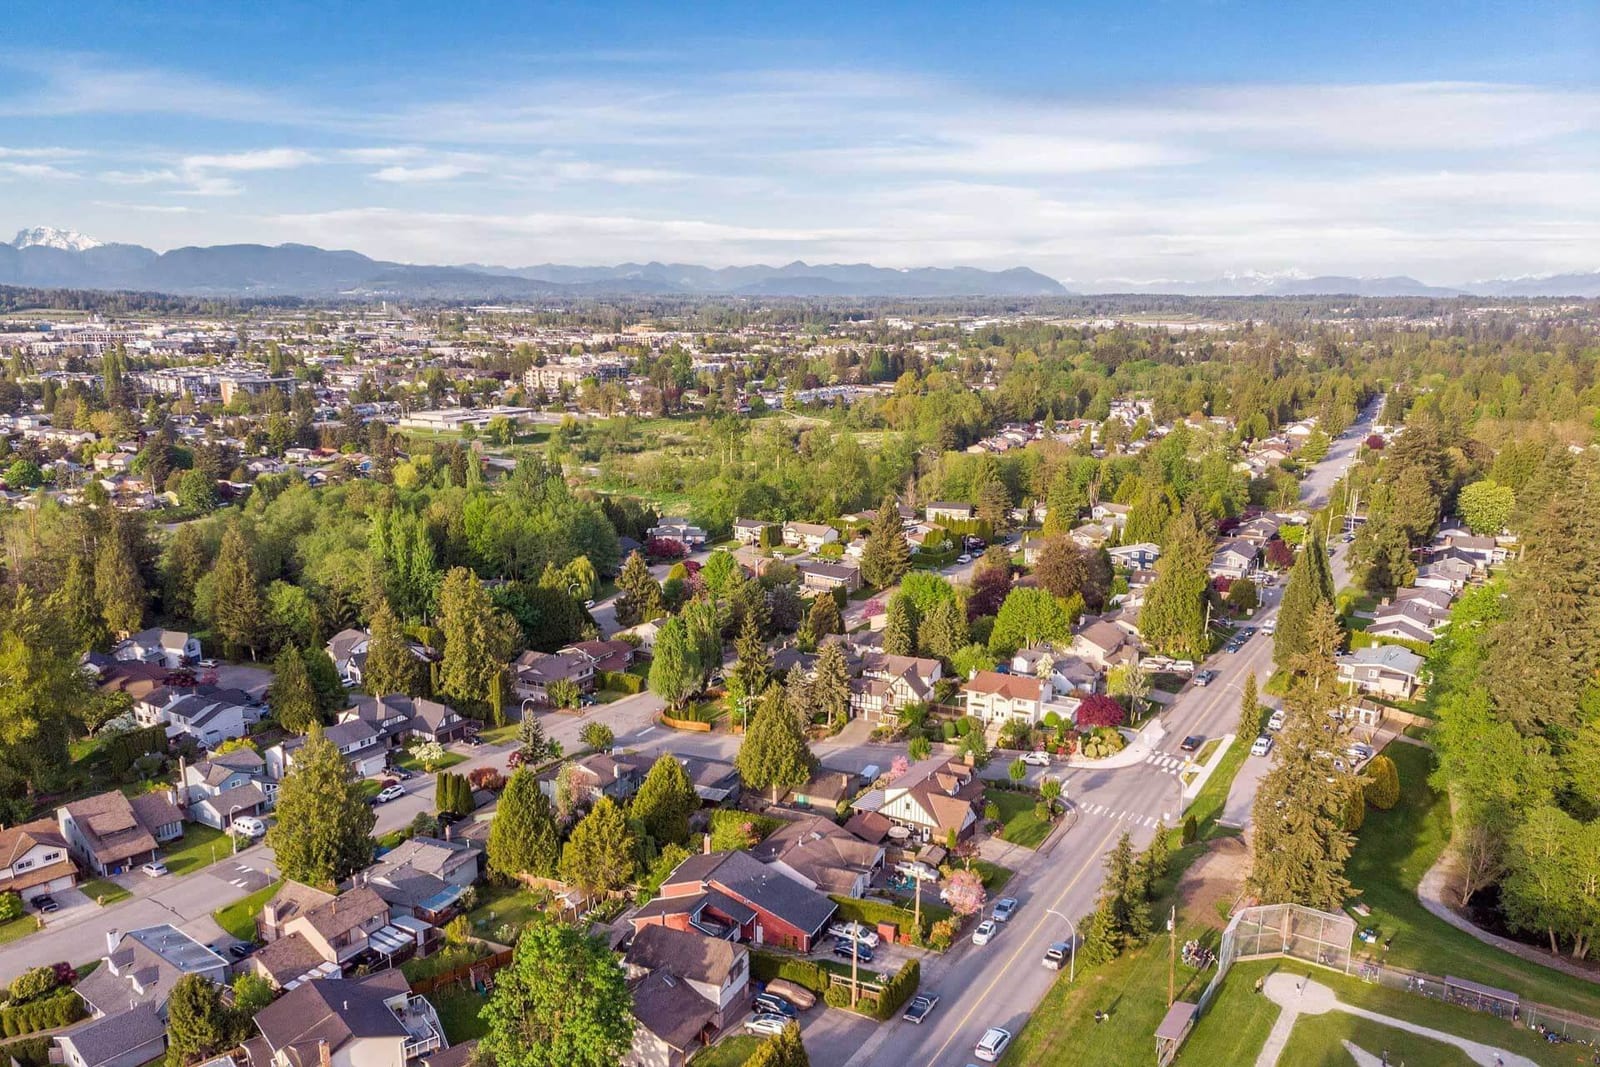
The City of Langley is a smaller market, and its numbers move more from month to month. Detached homes have a Benchmark of $1,165,000, down only 1.4% from October 2025, the smallest drop of the 12 categories. But the sales ratio of 7.9% is the lowest of any category, and days on market jumped to 33 from 11 a year ago. Holding price while buyers take their time can mean sellers haven't repriced yet.
City of Langley townhomes have the highest sales ratio of the 12 categories at 33.3%, up from 8.0% a year ago. The Benchmark of $733,700 is down 6.1%, and homes took 23 days on market, down from 42. A jump that large in a small segment can reverse quickly, so treat it as a signal and not a promise.
Condos have a Benchmark of $461,400, down 10.9% from last October, the steepest drop of the 12 categories. The sales ratio of 16.0% is balanced and homes took 27 days on market, down from 31. If you're buying a City of Langley condo, the price has already reset more than anywhere else I'm covering.
Maple Ridge: Lower Prices, Steadier Balance
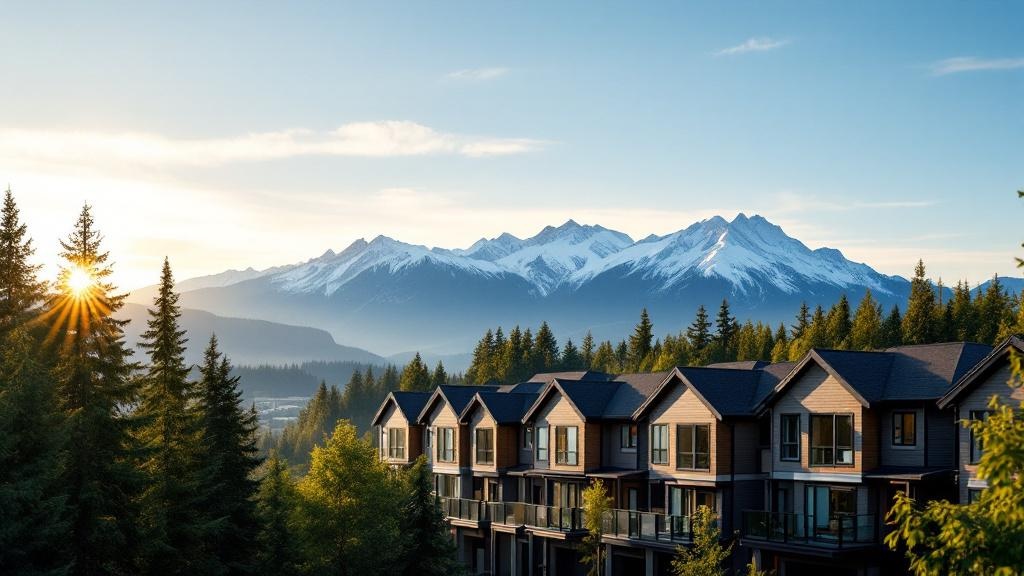
Maple Ridge has the lowest detached and townhome Benchmarks of the 4 areas. The detached Benchmark of $1,138,500 is $26,500 below the City of Langley, $241,600 below Surrey and $309,600 below the Township of Langley. It's also down 8.6% year over year.
What's different about Maple Ridge is the balance. All 3 property types sit inside the balanced range: detached at 15.5%, townhomes at 15.8% and condos at 17.6%. Detached and condo ratios rose from last October by 4.2 and 4.6 percentage points, while the townhome ratio fell 3.1 points from 18.9%.
Townhomes took the largest price hit in Maple Ridge, with the Benchmark of $686,600 down 9.5% year over year. Condos have a Benchmark of $481,600, down 8.2%, which puts them above Surrey and City of Langley condos but below the Township. Days on market are close together across all 3 types, between 31 and 33 days, and each is a day quicker than last year.
What This Means If You're Buying
If you want the most negotiating room, Surrey condos, Surrey detached homes and City of Langley detached homes are where the numbers favour you today. The sales ratios are under the balanced range and homes are taking 24 to 33 days to sell.
If you want a townhome in either part of Langley, plan for a faster market. Sales ratios of 29.2% in the Township and 33.3% in the City mean you shouldn't count on weeks of thinking time, so get your pre-approval and your strata document review process ready before you start looking.
Falling prices aren't a reason to wait in every category. In Langley townhomes, the sales ratios are already well above the balanced range, so waiting for a further price drop is a gamble, not a plan.
What This Means If You're Selling
Your category matters more than your city. A Township of Langley townhome seller and a Surrey condo seller are in 2 different markets.
If you're selling a Surrey condo or a Township of Langley condo, expect longer showing periods than last year and price from the Benchmark down, not the number you hoped for. Surrey condos are taking 24 days and Township condos 34 days. If you're selling a Langley townhome, you have the strongest position of the 12 categories, but the price still needs to be right from day one.
Maple Ridge sellers are in a middle position. The balanced ratios mean a well-prepared home can still sell at a fair price, but with Benchmarks down 8.2% to 9.5% in every category, using last year's sold prices as your starting point will set expectations too high.
Frequently Asked Questions
Are home prices going down in Surrey, Langley and Maple Ridge?
Yes. In October 2026 every one of the 12 categories I track had a lower Benchmark than October 2025, from 1.4% lower for City of Langley detached homes to 10.9% lower for City of Langley condos.
Which area is the best value for a detached home?
Maple Ridge has the lowest detached Benchmark at $1,138,500. The City of Langley is at $1,165,000, Surrey at $1,380,100 and the Township of Langley at $1,448,100. Value depends on your commute, lot size and what you're giving up, so compare the actual streets and not just the area average.
Is it a buyer's market right now?
It depends on the category. Surrey detached homes (11.4%), Surrey condos (9.5%) and City of Langley detached homes (7.9%) are below FVREB's balanced range of 12.0% to 20.0%. Township of Langley townhomes (29.2%) and City of Langley townhomes (33.3%) are above it. Everything else sits inside it.
What is the sales ratio?
It's the number of sales divided by the number of active listings in the month. A higher ratio means more of the available homes are selling.
How long are homes taking to sell?
In October 2026, days on market ranged from 19 days for Township of Langley detached homes to 34 days for Township of Langley condos.
What does Benchmark price mean?
It's the MLS® Home Price Index Benchmark, FVREB's price for a typical home in a category. It's designed to track price movement over time and isn't an average of the month's sales.
Thinking About Your Next Move?
The numbers above are a starting point, and every neighbourhood inside these 4 areas moves a little differently. If you'd like the buying steps laid out in one place, the Buyers Guide covers them, and you can Download it below. If you'd rather talk through your own situation, you can Book a Call.
Source: FVREB, October 2026 statistics. Prices are MLS® Home Price Index Benchmarks. Sales ratio is sales to active listings. Figures are for Surrey (City of Surrey combined), the Township of Langley (FVREB Langley area, F60), the City of Langley (F6A) and Maple Ridge by detached, townhome and condo.

Alex Dunbar Personal Real Estate Corporation
REAL Broker BC Ltd. | Living in the Lower Mainland
Buying, selling or investing in the Lower Mainland? Whether you're new to the area or a longtime local, I'll help you make the right move. Book a 30-minute no-pressure call with me and we'll figure out what works best for you.
Categories
Recent Posts


GET MORE INFORMATION